Monitoring Consumer product user experience KPIs
In this recipe, we'll use StarTree ThirdEye to monitor the "number of page views across multiple dimensions such as location, device, and browser". Number of page views is a critical metric to measure the success of consumer product user experience. In addition to monitoring the page views, this recipe covers how to perform root cause analysis to identify which dimensions changed and contributed the most to the outlier/deviation in the metric (spike or drop or trend change).
Monitor KPIs

Detect outliers and investigate

Challenges that impact user experience
User experience is crucial to the success of every consumer product and business. Improving user experience increases user engagement and revenue for consumer products, including retail, eCommerce, and fintech. For example, increasing user engagement for consumer user-facing products such as LinkedIn and Facebook can result in increased ads revenue.
Companies with the highest user engagement scores have generated twice as much shareholder value over the last few years relative to the average score.
- Unexpected surges in user traffic to your website could result from an A/B test or a new campaign launch. Knowing the root cause can help you make informed decisions for running A/B tests and campaign performance management.
- Unexpected drops in website traffic are important to monitor. For example, a browser upgrade may increased load time for pages or timeout on your website, which can drive users away from your retail website resulting in revenue loss.
What is the solution? Anomaly detection in user experience
To drive user engagement and improved user experience for consumer products, one must constantly monitor the essential consumer product KPIs (key performance indicators) such as page views to detect anomalies across geographies, products/services, and devices (browser/desktop), etc.
An anomaly is an unexpected change. Anomaly detection can help by detecting the anomaly, notifying the product analytics and business operations teams, and providing the root cause to make better-informed decisions.
How StarTree ThirdEye will help improve the user experience?
Metrics can be explored and analyzed in any data visualization and reporting platform such as Superset, Tableau, and PowerBI – The visualization tools do not support:
- Analyzing multi-dimensional metrics
- Smart alerting mechanisms with shifting metrics trends
- RCAs (root cause analysis)
Here are some benefits to using StarTree ThirdEye:
-
Determining which devices and geographies were impacted and by how much on a daily basis is a laborious task. StarTree ThirdEye can analyze multi-dimensional metrics (for example, page views can be analyzed by multiple dimensions such as geography, devices, and browsers) and can generate multiple time series for the same metric.
-
Monitoring the “page views” metric across many geographies and devices (desktop vs mobile) will generate many time series for the “page views” metric across all the permutations of geographies and devices.
-
Lacking a robust and smart alerting mechanism to identify the most impacted area will result in blind spots and increased costs due to manual investigations. StarTree ThirdEye has a smart alerting feature that can configure a multi-level alerting hierarchy based on the severity of the alerts and the multiple dimensions of a metric with a single alert configuration. It sends notifications to slack, email, and custom notifications platforms (using webhooks). It can also associate with custom events (such as browser upgrades that could have resulted in a drop in page views).
-
Analyzing and identifying the root cause of an issue across multiple dimensions and related events in real-time is of the most difficult challenges for every organization. StarTree ThirdEye can perform root cause analysis across metrics, dimensions, and the impact of one event on the metrics in an easy-to-consumable graphic.
Identify patterns of seasonality
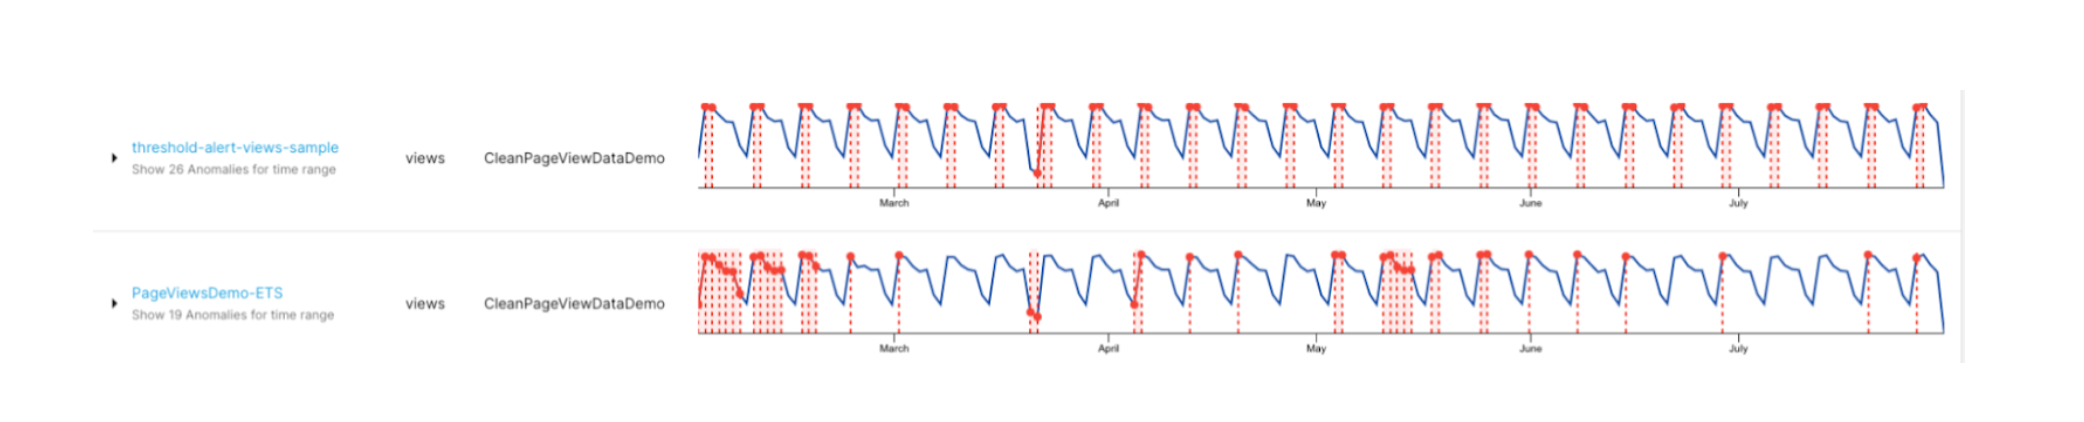
Page views seasonality by the weekend: Many retail websites have spikes or drops during holidays or weekends. Identifying outliers/anomalies in a data stream is useless if the algorithms cannot account for seasonal fluctuations.
Here is a sample visualization of daily page views over a period of time as compared to simple threshold-based alerting. As seen here, StarTree ThirdEye does not flag every dip as an anomaly. It can identify the anomalies while considering the seasonality.
Note: Join the StarTree Slack community to ask questions and learn more (link (opens in a new tab)).
StarTree ThirdEye comes with a lot of API calls (link) making it possible for you to build your own custom portals/web wrapper over StarTree ThirdEye. As a user, you have more control over using and customizing StarTree ThirdEye in creating great user experiences.
Interested in trying out StarTree ThirdEye?
Follow this link to find different deployment options for trying out StarTree ThirdEye.
Architecture diagram

Use StarTree ThirdEye anomaly detection for real-time or near real-time monitoring
-
- Data preparation and availability
-
- Data ingestion
-
- Alert creation and notifications
-
- Tuning anomaly detection models (if needed based on use-case and context)
-
- Anomaly reporting
- Root-cause analysis: Anomaly investigation
Data preparation and availability
-
Identify key metrics to monitor. One of the core metrics for learning about user engagement is:
- Number of pageviews
-
Identify the dimensions that are applicable for a given metric:
- Country
- Browser version
- Device
- Mobile OS version
-
Decide granularity for your detection: Granularity enables you for real-time or near real-time monitoring (hourly/daily/weekly time series).
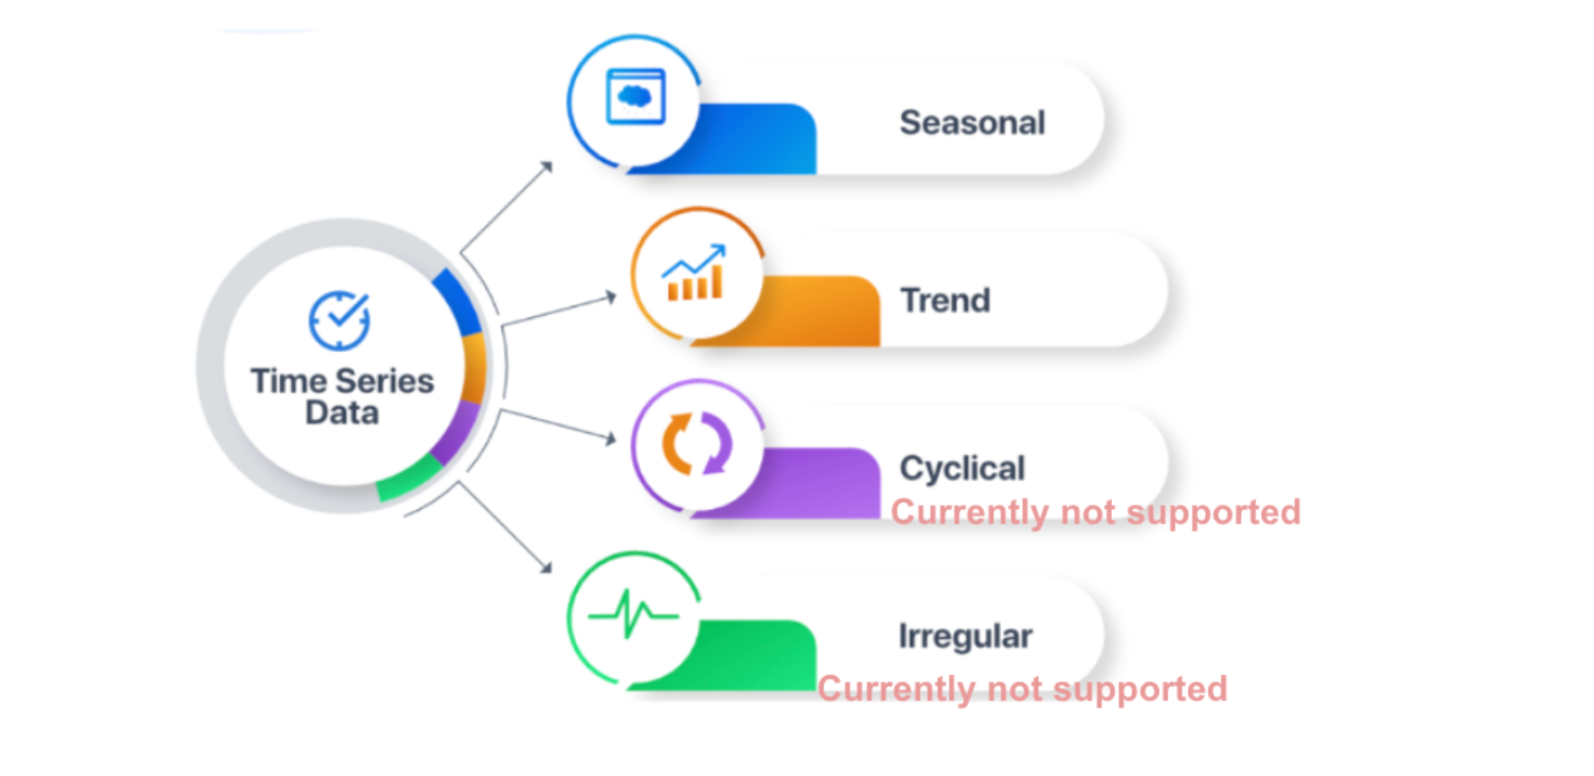
Types of time series data
| country | version | browser | gender | device | os | views | pageviewdate |
|---|---|---|---|---|---|---|---|
| US | 0.3 | chrome | M | phone | iOS | 4888 | 2020-02-02 |
| US | 0.3 | chrome | M | phone | Android | 5703 | 2020-02-02 |
| US | 0.3 | chrome | M | phone | OSX | 1629 | 2020-02-03 |
| US | 0.3 | chrome | M | phone | Windows | 3259 | 2020-02-03 |
| US | 0.3 | chrome | M | phone | Linux | 814 | 2020-02-03 |
| US | 0.3 | chrome | M | desktop | iOS | 2851 | 2020-02-03 |
| US | 0.3 | chrome | M | desktop | Android | 3326 | 2020-02-04 |
| US | 0.3 | chrome | M | desktop | OSX | 950 | 2020-02-04 |
Data ingestion
- Download this CSV file (link (opens in a new tab)).
- Ingest this CSV data to Pinot using Data Manager (link) or Pinot API.
- The Pinot schema should look like this:
{
  "schemaName": "CleanPageViewDataDemo",
  "**dimensionFieldSpecs**": [
    {
      "name": "browser",
      "dataType": "STRING"
    },
    {
      "name": "country",
      "dataType": "STRING"
    },
    {
      "name": "device",
      "dataType": "STRING"
    },
    {
      "name": "gender",
      "dataType": "STRING"
    },
    {
      "name": "os",
      "dataType": "STRING"
    },
    {
      "name": "version",
      "dataType": "STRING"
    }
  ],
  "**metricFieldSpecs**": [
    {
      "name": "views",
      "dataType": "LONG"
    }
  ],
  "**dateTimeFieldSpecs**": [
    {
      "name": "pageviewdate",
      "dataType": "STRING",
      "format": "1:MILLISECONDS:SIMPLE_DATE_FORMAT:yyyy-MM-dd",
      "granularity": "1:MILLISECONDS"
    }
  ]
}Note: The “dateTimeFieldSpecs” will be used to set the granularity and understand the seasonality for accurate predictions by anomaly detectors.
Alert creation and notifications
-
Refer to this how-to guide to create an alert (link) and use the following alert configurations to create alerts
-
Subscribe to notifications (link)
Use the following alert configuration for “Simple threshold based alert creation”.
{
  "name": "threshold-alert-views-sample-alert",
  "description": "Threshold alert on page views",
  "template": {
    "name": "startree-threshold"
  },
  "templateProperties": {
    "dataSource": "pinot",
    "dataset": "CleanPageViewDataDemo",
    "aggregationFunction": "max",
    "aggregationColumn": "views",
    "monitoringGranularity": "P1D",
    "max": "15000",
    "min": "3000"
  },
  "cron": "0 0 0/2 1/1 * ? *"
}
Use the following alert configuration for “Startree-ets alert creation” (advanced detection model based on metrics pattern and seasonality)
{
  "name": "Startree-ETS-views-sample-alert",
  "description": "Uses template startree-ets.",
  "template": {
    "name": "startree-ets"
  },
  "templateProperties": {
    "dataSource": "pinot",
    "dataset": "CleanPageViewDataDemo",
    "aggregationFunction": "sum",
    "aggregationColumn": "views",
    "seasonalityPeriod": "P30D",
    "lookback": "P120D",
    "monitoringGranularity": "P1D",
    "sensitivity": "7"
  },
  "cron": "0 0 0 1/1 * ? *"
}
Use the following alert configuration for “Startree-ets alert creation” (advanced detection model based on metrics pattern and seasonality + dimension exploration (multiple-timeseries)) (Learn more about the concepts by clicking this link)
{
  "name": "pageviewsdemo-ets-dx",
  "description": "",
  "template": {
    "name": "startree-ets-dx"
  },
  "templateProperties": {
    "dataSource": "pinot",
    "dataset": "CleanPageViewDataDemo",
    "aggregationFunction": "sum",
    "seasonalityPeriod": "P7D",
    "lookback": "P20D",
    "monitoringGranularity": "P1D",
    "sensitivity": "1",
    "aggregationColumn": "views",
    "queryFilters": "${queryFilters}",
    "enumerationItems": [
      {
        "name": "overall",
        "params": {
          "queryFilters": ""
        }
      },
      {
        "name": "US",
        "params": {
          "queryFilters": " AND country = 'US'"
        }
      },
      {
        "name": "chrome",
        "params": {
          "queryFilters": " AND browser = 'chrome'"
        }
      }
    ]
  },
  "cron": "0 0 5 ? * * *"
}
Tuning anomaly detection models
To reduce the number of false alarms, based on the business logic and contexts, StarTree ThirdEye allows you to customize anomaly criteria in the following way (Learn more about alert tuning by clicking this link):
Adjust the sensitivity and rules (you can use query filters) at various levels (metric, group, series)
- Metric level: In the alert config you have just provided metric and no filters then it will tune the time series under that metrics
- Specific dimension value or group of dimensions: In the alert, config specify query filters and this gives the ability to tune the time series at a group of dimensions level for the given metrics
- Once anomaly detected feedback can be given on the anomaly or missed anomaly can be reported for adaptive learning and better accuracy
- StarTree ThirdEye allows you to configure "Anomaly filters"
- Coldstart filter
- Weekday filter
- Threshold filter
- Guardrail metric threshold filter
- Holiday filter
{
"name": "pageviews-sample-tune-alert",
"description": "test",
"template": {
"name": "startree-ets"
},
"templateProperties": {
"dataSource": "pinot",
"dataset": "CleanPageViewDataDemo",
"aggregationFunction": "sum",
"lookback": "P28D",
"monitoringGranularity": "P1D",
"sensitivity": "8",
"aggregationColumn": "views",
"queryFilters": "AND browser='chrome' AND os='iOS'",
"eventSqlFilter": "'US' member of dimensionMap['countryCode']",
"eventTypes": [
"HOLIDAY"
],
"daysOfWeek": [],
"hoursOfDay": [],
"dayHoursOfWeek": {},
"thresholdFilterMin": "-1",
"thresholdFilterMax": "-1",
"guardrailMetricMin": "-1",
"guardrailMetricMax": "-1",
"guardrailMetric": "COUNT(*)"
},
"cron": "0 0 5 ? * * *"
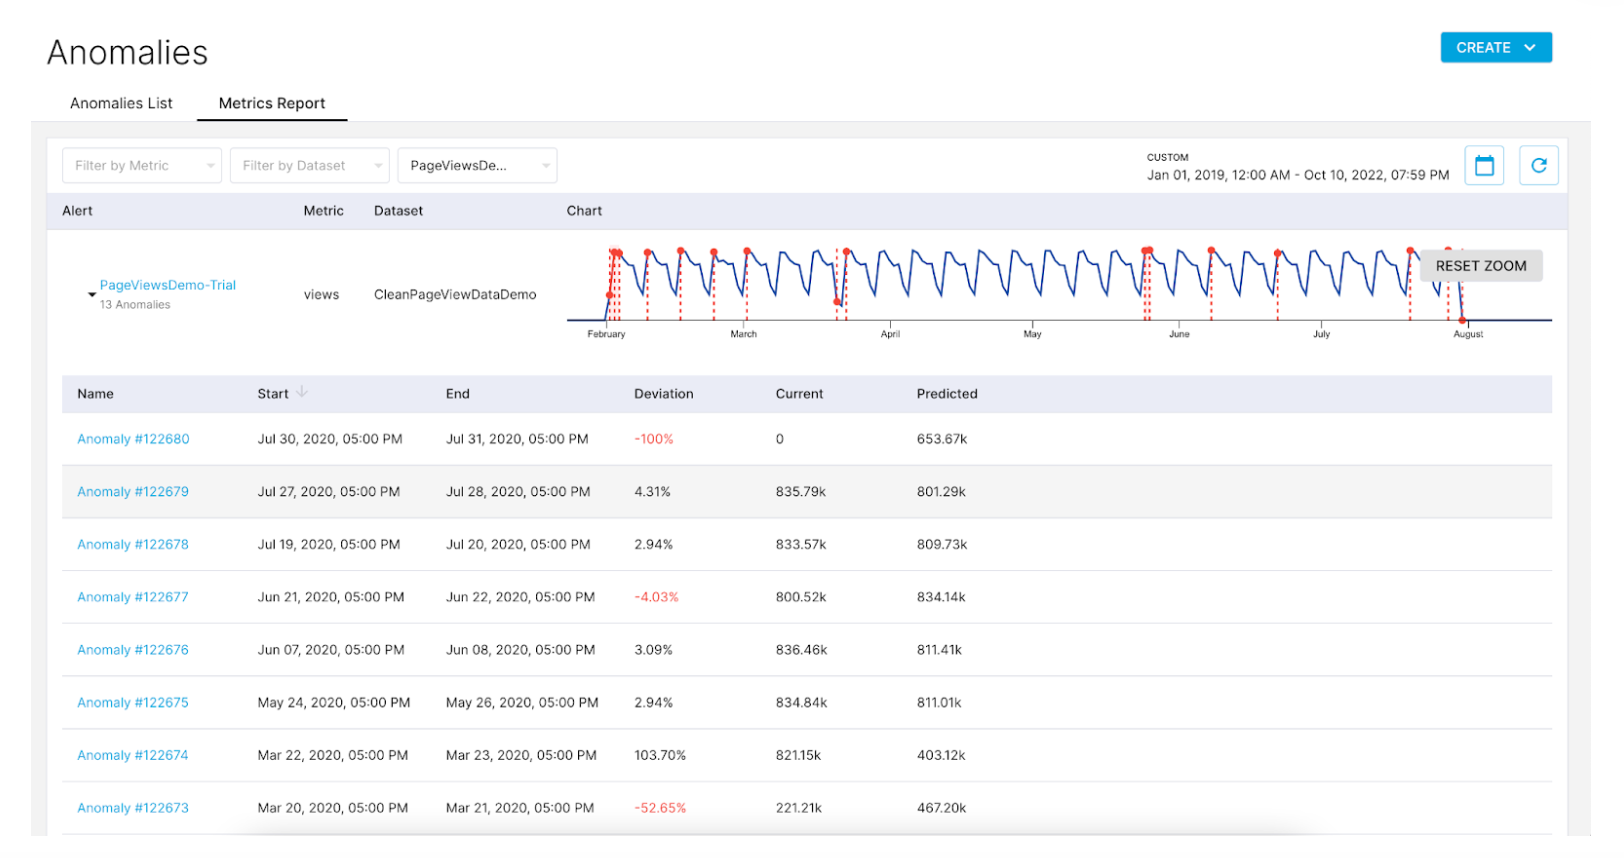
}Anomaly reporting
Anomalies can be reported in multiple ways using ThirdEye, such as:
- Slack
- Webhook
- Using APIs
- Viewing the anomalies directly in ThirdEye
Here is the link to a “how to guide” which describes how the different types of notifications (Email, Slack, Webhook) can be used to report anomalies.
You can also pull these anomalies using the ThirdEye API link to guide and report those anomalies your custom application.
Access anomalies directly in the ThirdEye UI. link
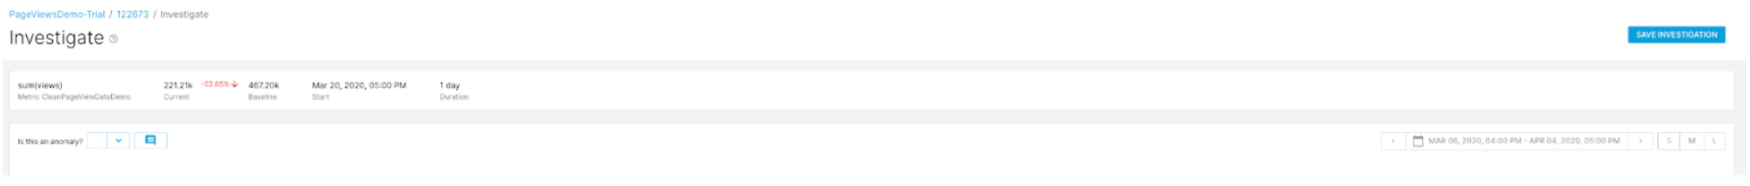
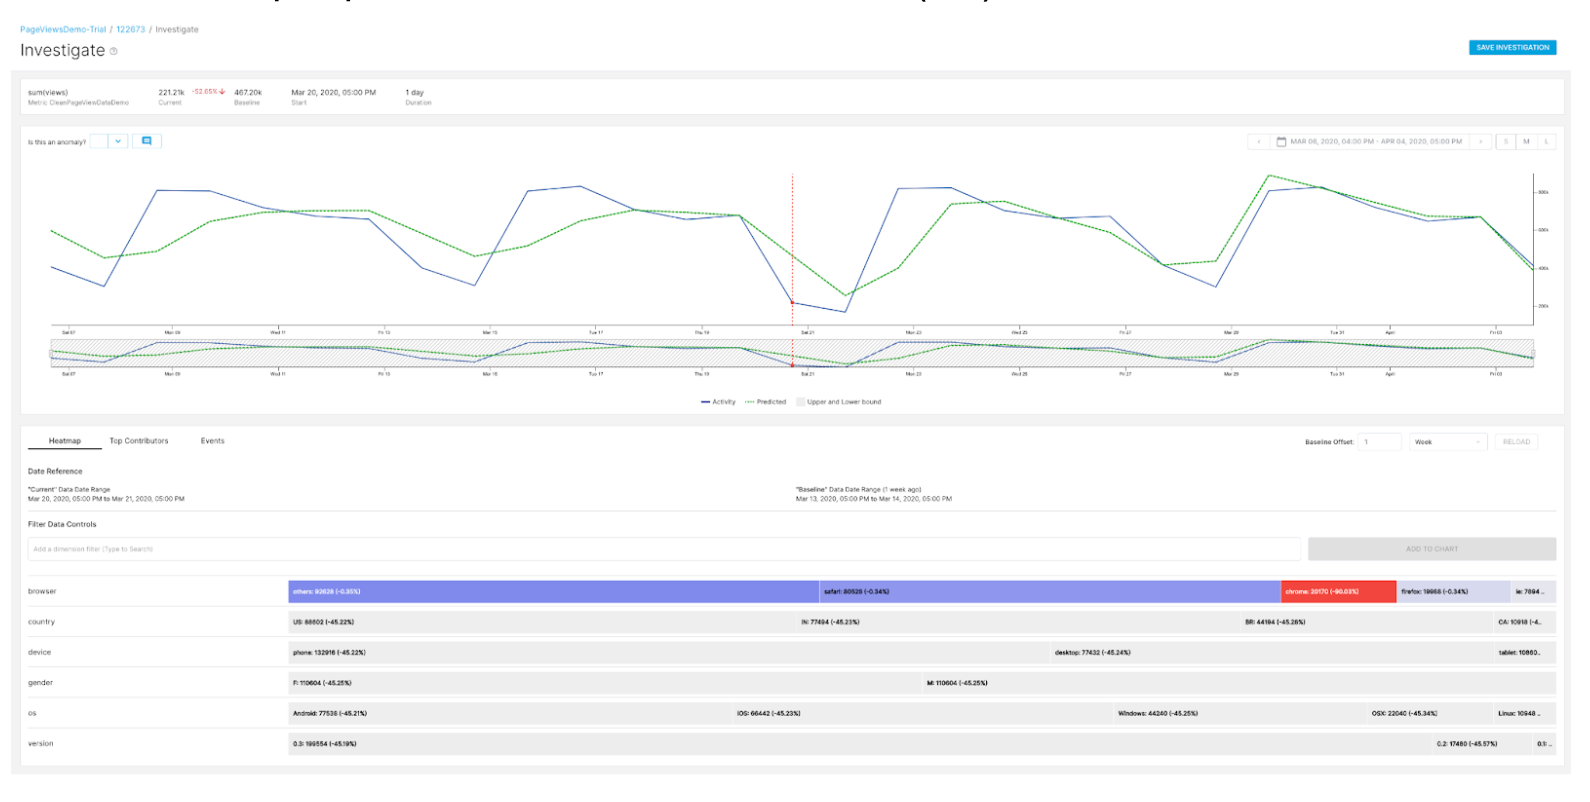
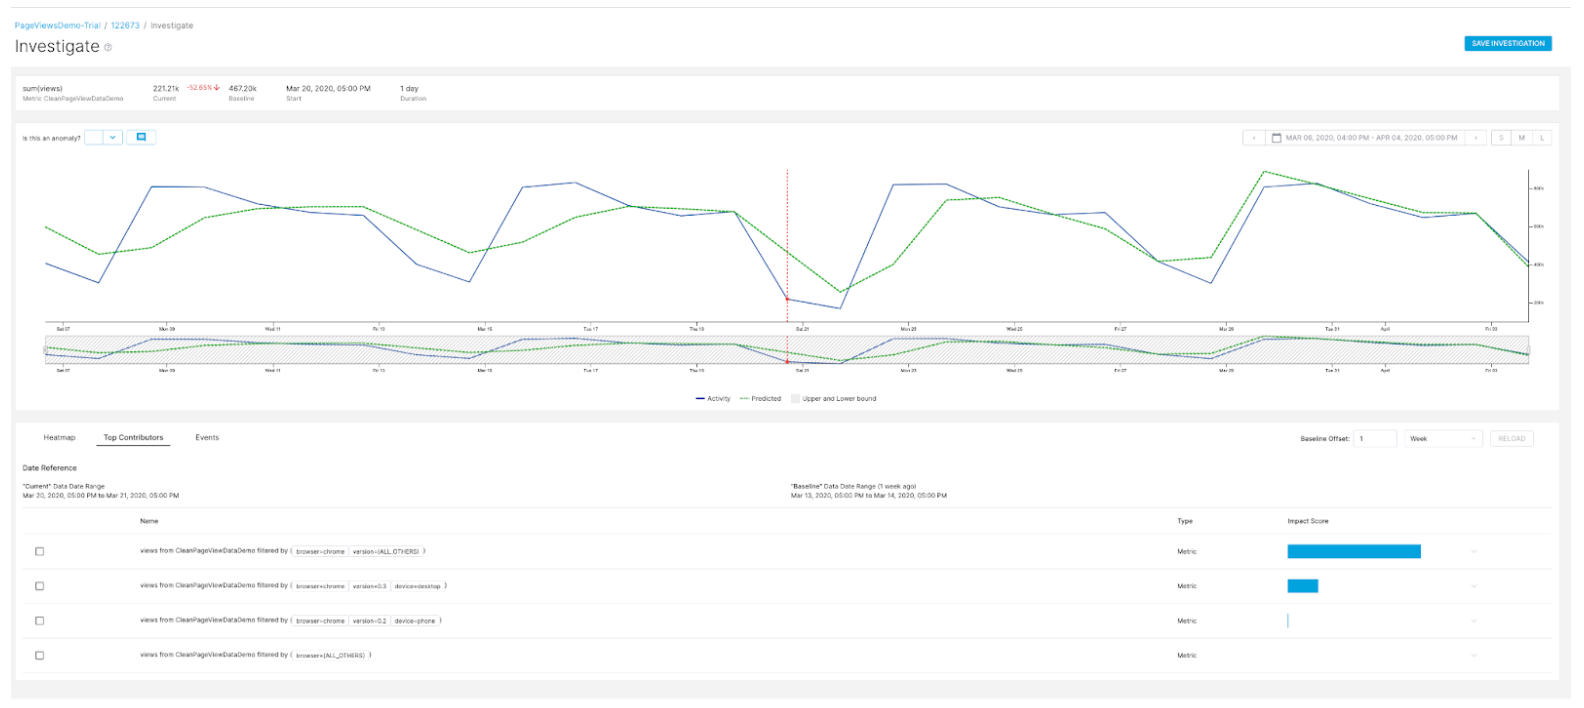
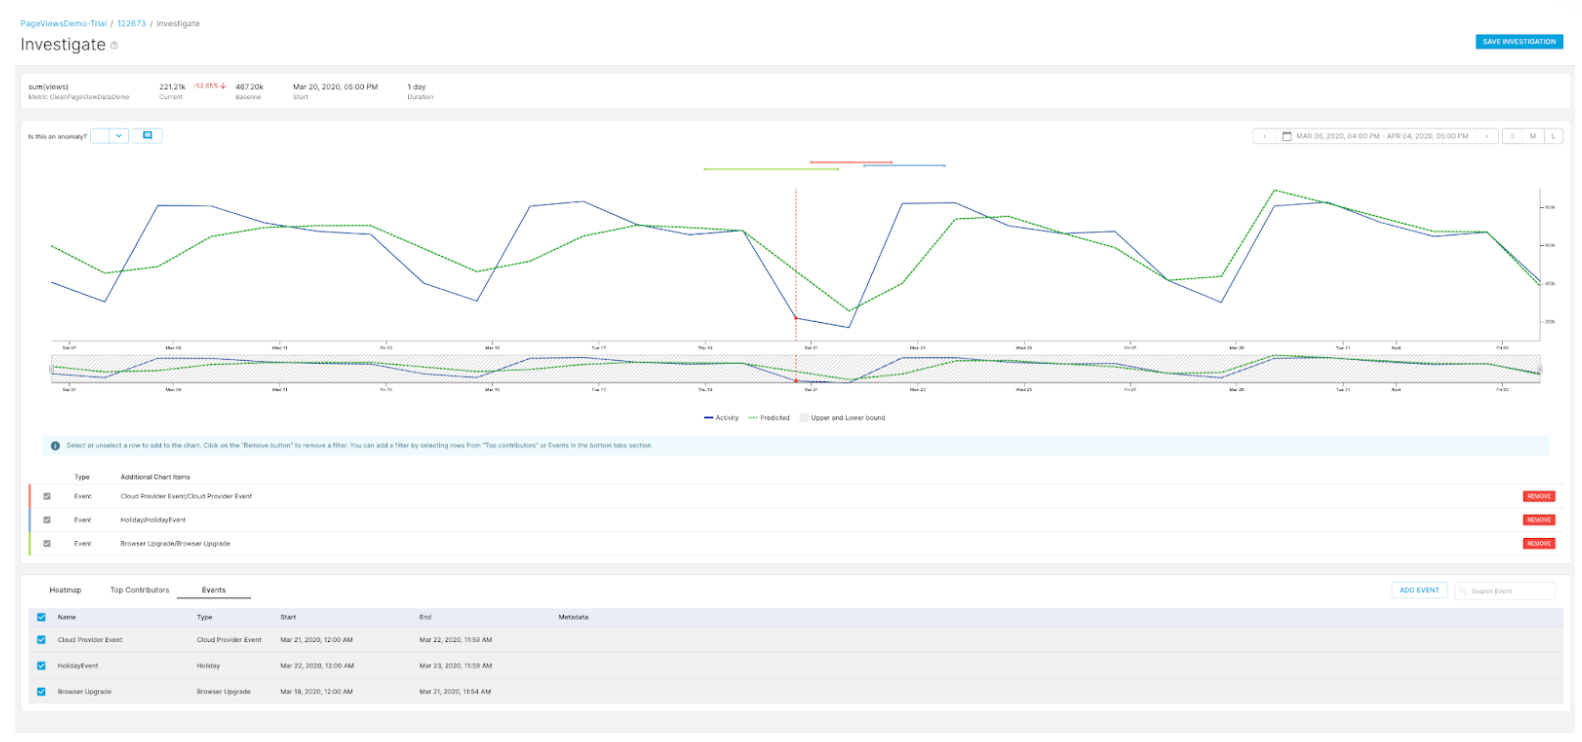
Root cause analysis: Anomaly investigation
Here is the how-to guide to perform root cause analysis by investigating anomalies with signals from the heatmap, top contributors, and custom events: (link).
You can save investigations and provide feedback on the anomaly which can be an input to improve model performance and accuracy.