Monitoring Ad Campaign Performance
Ad campaigns are very crucial to the business and success of a product or the company. The difference in the customer impact created by the advertisements can decide whether a product skyrockets or fails in the market. These high stakes makes it critical to measure the performance of an ad campaign and take instant measures to improve the performance and make the campaign successful.
One of the important factor here is identifying the issues as early as possible as every aspect is time sensitive and losses are exponential with respect to time. Minimizing the damage by identifying and investigating the issue in real time is where ThirdEye comes into picture. In this recipe, we'll use Startree ThirdEye to monitor ad campaign data and investigate the anomalies generated by ThirdEye for the anomalous behaviors.
Architecture diagram

Here are the steps to quickly try this out
- Data preparation and availability
- Data ingestion
- Alert creation and notifications
- Anomaly reporting
- Root-cause analysis: anomaly investigation
Data Preparation and Availability
-
Identify key metrics to monitor. One of the core metrics for learning about ad campaign is:
- Number of clicks
-
Identify the dimensions that are applicable for a given metric:
- Country
- Exchange
-
Decide granularity for your detection:
- Granularity enables you for real-time or near real-time monitoring (hourly/daily/weekly time series).
| AdCampaignSize | AdCampaignType | CampaignDeliveryTimestamp | Clicks | Country | Exchange | FailedBids | Impressions | LostBids |
|---|---|---|---|---|---|---|---|---|
| Small | Display | 1512867600 | 22037.0945 | USA | DoubleClick | 2455.1668 | 6784.6904 | 2973.6278 |
| Small | Display | 1512871200 | 22505.3753 | USA | DoubleClick | 2473.1984 | 6839.1905 | 2940.1981 |
| Small | Display | 1512874800 | 22758.7071 | USA | DoubleClick | 2485.5029 | 6909.3346 | 3003.7753 |
| Small | Display | 1512878400 | 23112.5034 | USA | DoubleClick | 2590.7555 | 7158.9725 | 2966.8914 |
| Small | Display | 1512882000 | 23830.7055 | USA | DoubleClick | 2639.0802 | 7235.7574 | 2950.0345 |
| Small | Display | 1512885600 | 23979.5515 | USA | DoubleClick | 2666.9261 | 7176.2341 | 3086.7601 |
| Small | Display | 1512889200 | 24021.3573 | USA | DoubleClick | 2683.2993 | 7427.7744 | 2969.4343 |
| Small | Display | 1512892800 | 24228.0634 | USA | DoubleClick | 2792.0565 | 7568.5963 | 3047.8218 |
| Small | Display | 1512896400 | 24914.9754 | USA | DoubleClick | 2896.0142 | 7854.9466 | 3034.1817 |
| Small | Display | 1512900000 | 25691.9473 | USA | DoubleClick | 2804.6276 | 7685.0893 | 3032.0785 |
Data ingestion
- Download this CSV file (opens in a new tab).
- Ingest the CSV data into Pinot [using Data Manager] (/docs/use-data-manager/upload-file)) or the Pinot API.
- The Pinot schema should look like this:
{
  "schemaName": "AdCampaignData",
  "dimensionFieldSpecs": [
    {
      "name": "AdCampaignSize",
      "dataType": "STRING"
    },
    {
      "name": "Country",
      "dataType": "STRING"
    },
    {
      "name": "AdCampaignType",
      "dataType": "STRING"
    },
    {
      "name": "Exchange",
      "dataType": "STRING"
    }
  ],
  "metricFieldSpecs": [
    {
      "name": "Impressions",
      "dataType": "DOUBLE"
    },
    {
      "name": "Clicks",
      "dataType": "DOUBLE"
    },
    {
      "name": "LostBids",
      "dataType": "DOUBLE"
    },
    {
      "name": "FailedBids",
      "dataType": "DOUBLE"
    }
  ],
  "dateTimeFieldSpecs": [
    {
      "name": "CampaignDeliveryTimestamp",
      "dataType": "LONG",
      "format": "1:SECONDS:EPOCH",
      "granularity": "1:SECONDS"
    }
  ]
}Note: The “dateTimeFieldSpecs” will be used to set the granularity and understand the seasonality for accurate predictions by anomaly detectors.
Alert creation and notifications
- See how to create an alert) and use the following alert configurations to create alerts
- Subscribe to notifications (link)
Create a simple percentage rule-based alert
{
  "name": "AdCampaignData-percentage-sample-alert-test",
  "description": "Monitor number of clicks",
  "template": {
    "name": "startree-percentage-rule"
  },
  "templateProperties": {
    "dataSource": "pinot",
    "dataset": "AdCampaignData",
    "aggregationFunction": "sum",
    "seasonalityPeriod": "P7D",
    "monitoringGranularity": "P1D",
    "aggregationColumn": "Clicks",
    "baselineOffset": "P7D",
    "percentageChange": "0.01"
  },
  "cron": "0 0 5 ? * * *"
}
Use the following alert configuration for “Startree-ets alert creation”
Advanced detection model based on metrics pattern and seasonality
{
  "name": "AdCampaignData-seasonal-sample-alert",
  "description": "Monitor number of clicks",
  "template": {
    "name": "startree-ets"
  },
  "templateProperties": {
    "dataSource": "pinot",
    "dataset": "AdCampaignData",
    "aggregationFunction": "sum",
    "seasonalityPeriod": "P7D",
    "lookback": "P20D",
    "monitoringGranularity": "P1D",
    "sensitivity": "1",
    "aggregationColumn": "Clicks"
  },
  "cron": "0 0 5 ? * * *"
}
Use the following alert configuration for “Startree-ets multidimensional alert creation”
Exponential smoothing (ETS) (opens in a new tab) is a technique for smoothing time series data that uses a window or tapering function. This is an advanced detection model based on metrics pattern and seasonality plus dimension exploration (multiple-timeseries). Learn more about dimension exploration concepts.
{
  "name": "AdCampaignData-seasonal-dx-sample-alert",
  "description": "Monitor number of clicks across multiple dimensions such as Country and Ad Campaign Size",
  "template": {
    "name": "startree-ets-dx"
  },
  "templateProperties": {
    "dataSource": "pinot",
    "dataset": "AdCampaignData",
    "aggregationFunction": "sum",
    "seasonalityPeriod": "P7D",
    "lookback": "P20D",
    "monitoringGranularity": "P1D",
    "sensitivity": "1",
    "aggregationColumn": "Clicks",
    "queryFilters": "${queryFilters}",
    "enumerationItems": [
      {
        "name": "Overall",
        "params": {
          "queryFilters": ""
        }
      },
      {
        "name": "DoubleClick-Canada",
        "params": {
          "queryFilters": " AND Country='Canada'"
        }
      },
      {
        "name": "DoubleClick-US",
        "params": {
          "queryFilters": " AND Country='USA'"
        }
      }
    ]
  },
  "cron": "0 0 5 ? * * *"
}
Anomaly reporting
Anomalies can be reported in multiple ways using ThirdEye, including:
- Slack
- Webhook
- Using APIs
- Viewing the anomalies directly in ThirdEye
Learn different ways to add notifications (for example, email, Slack, and webhooks).
You can also use the ThirdEye API to report anomalies your custom application, or access anomalies in the ThirdEye UI.
Analyze anomalies to find the root cause
Follow this guide to perform root cause analysis with heatmaps, custom events, and other signals. From this analysis you will see that out of the few anomalies that are detected by ThirdEye, the one detected from March 28, 2018 to March 29, 2018 shows a dip of around 120k clicks fewer than predicted.
In the heatmap, you'll see no prominent dimension contributing to the dip.
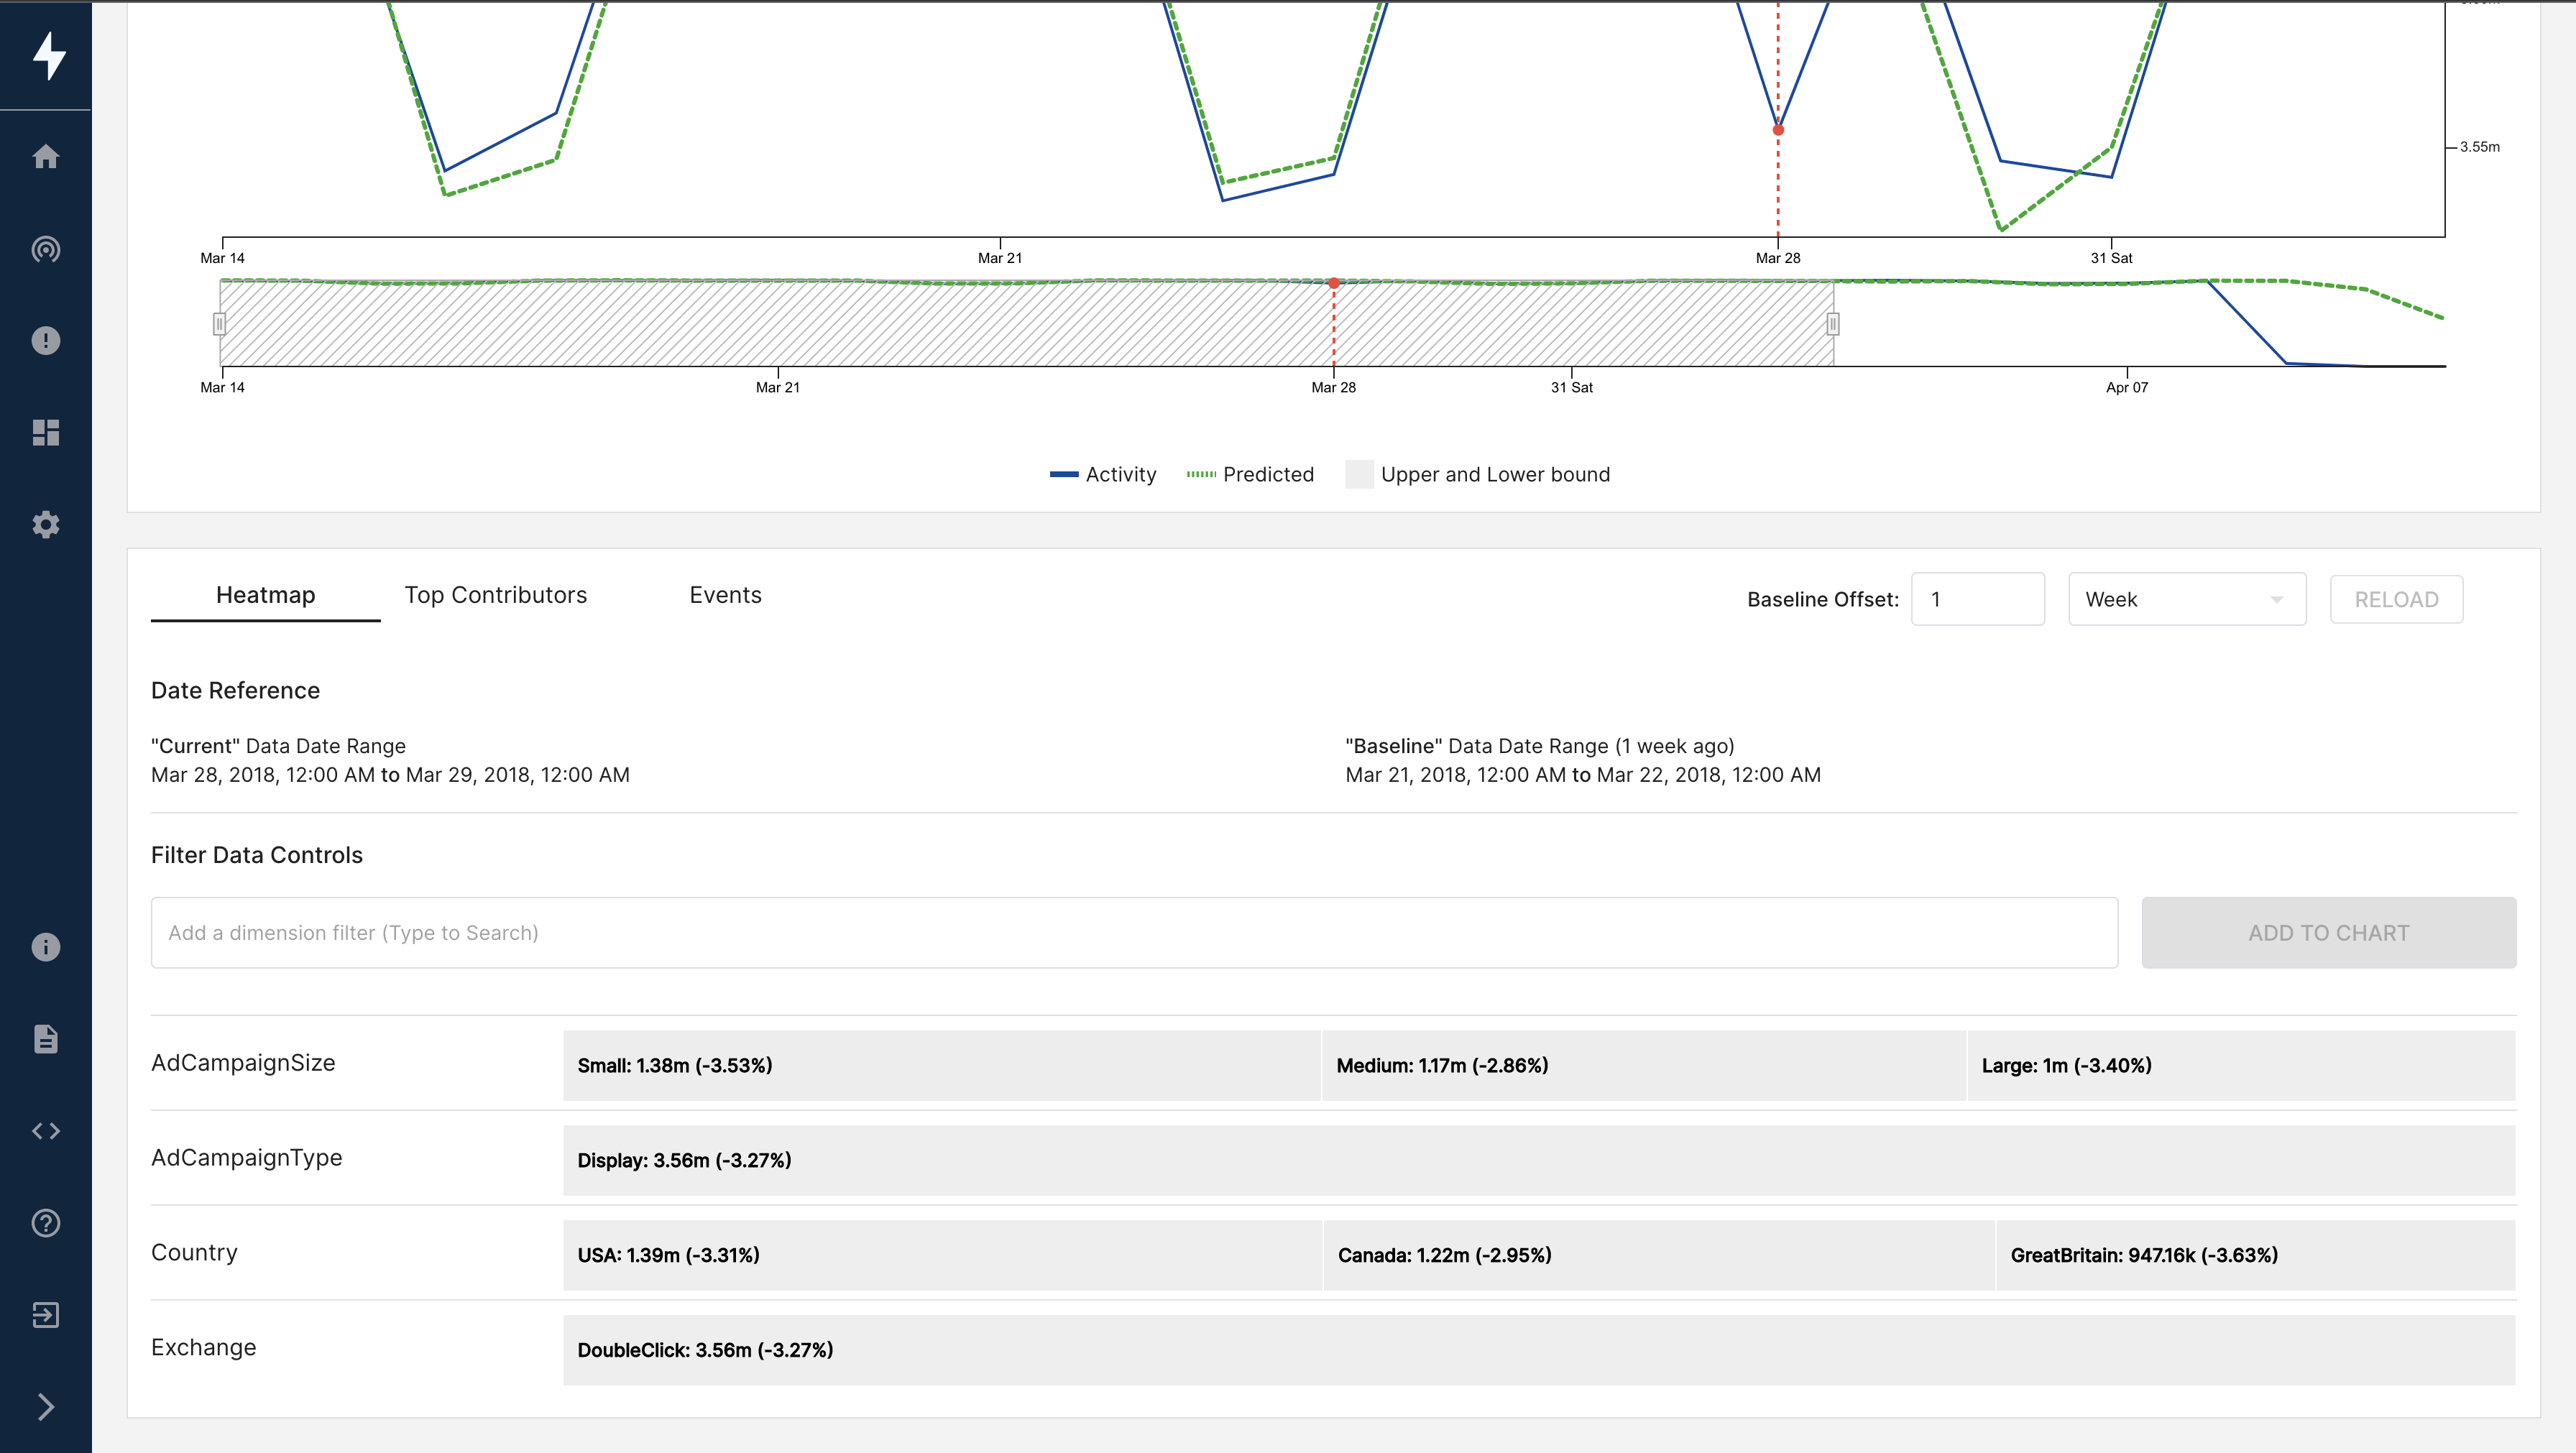
But if you observe the list of events around that time, you'll see why the dip happened. Around the same time, two events took place:
- ProductCatalogChange
- API Failures
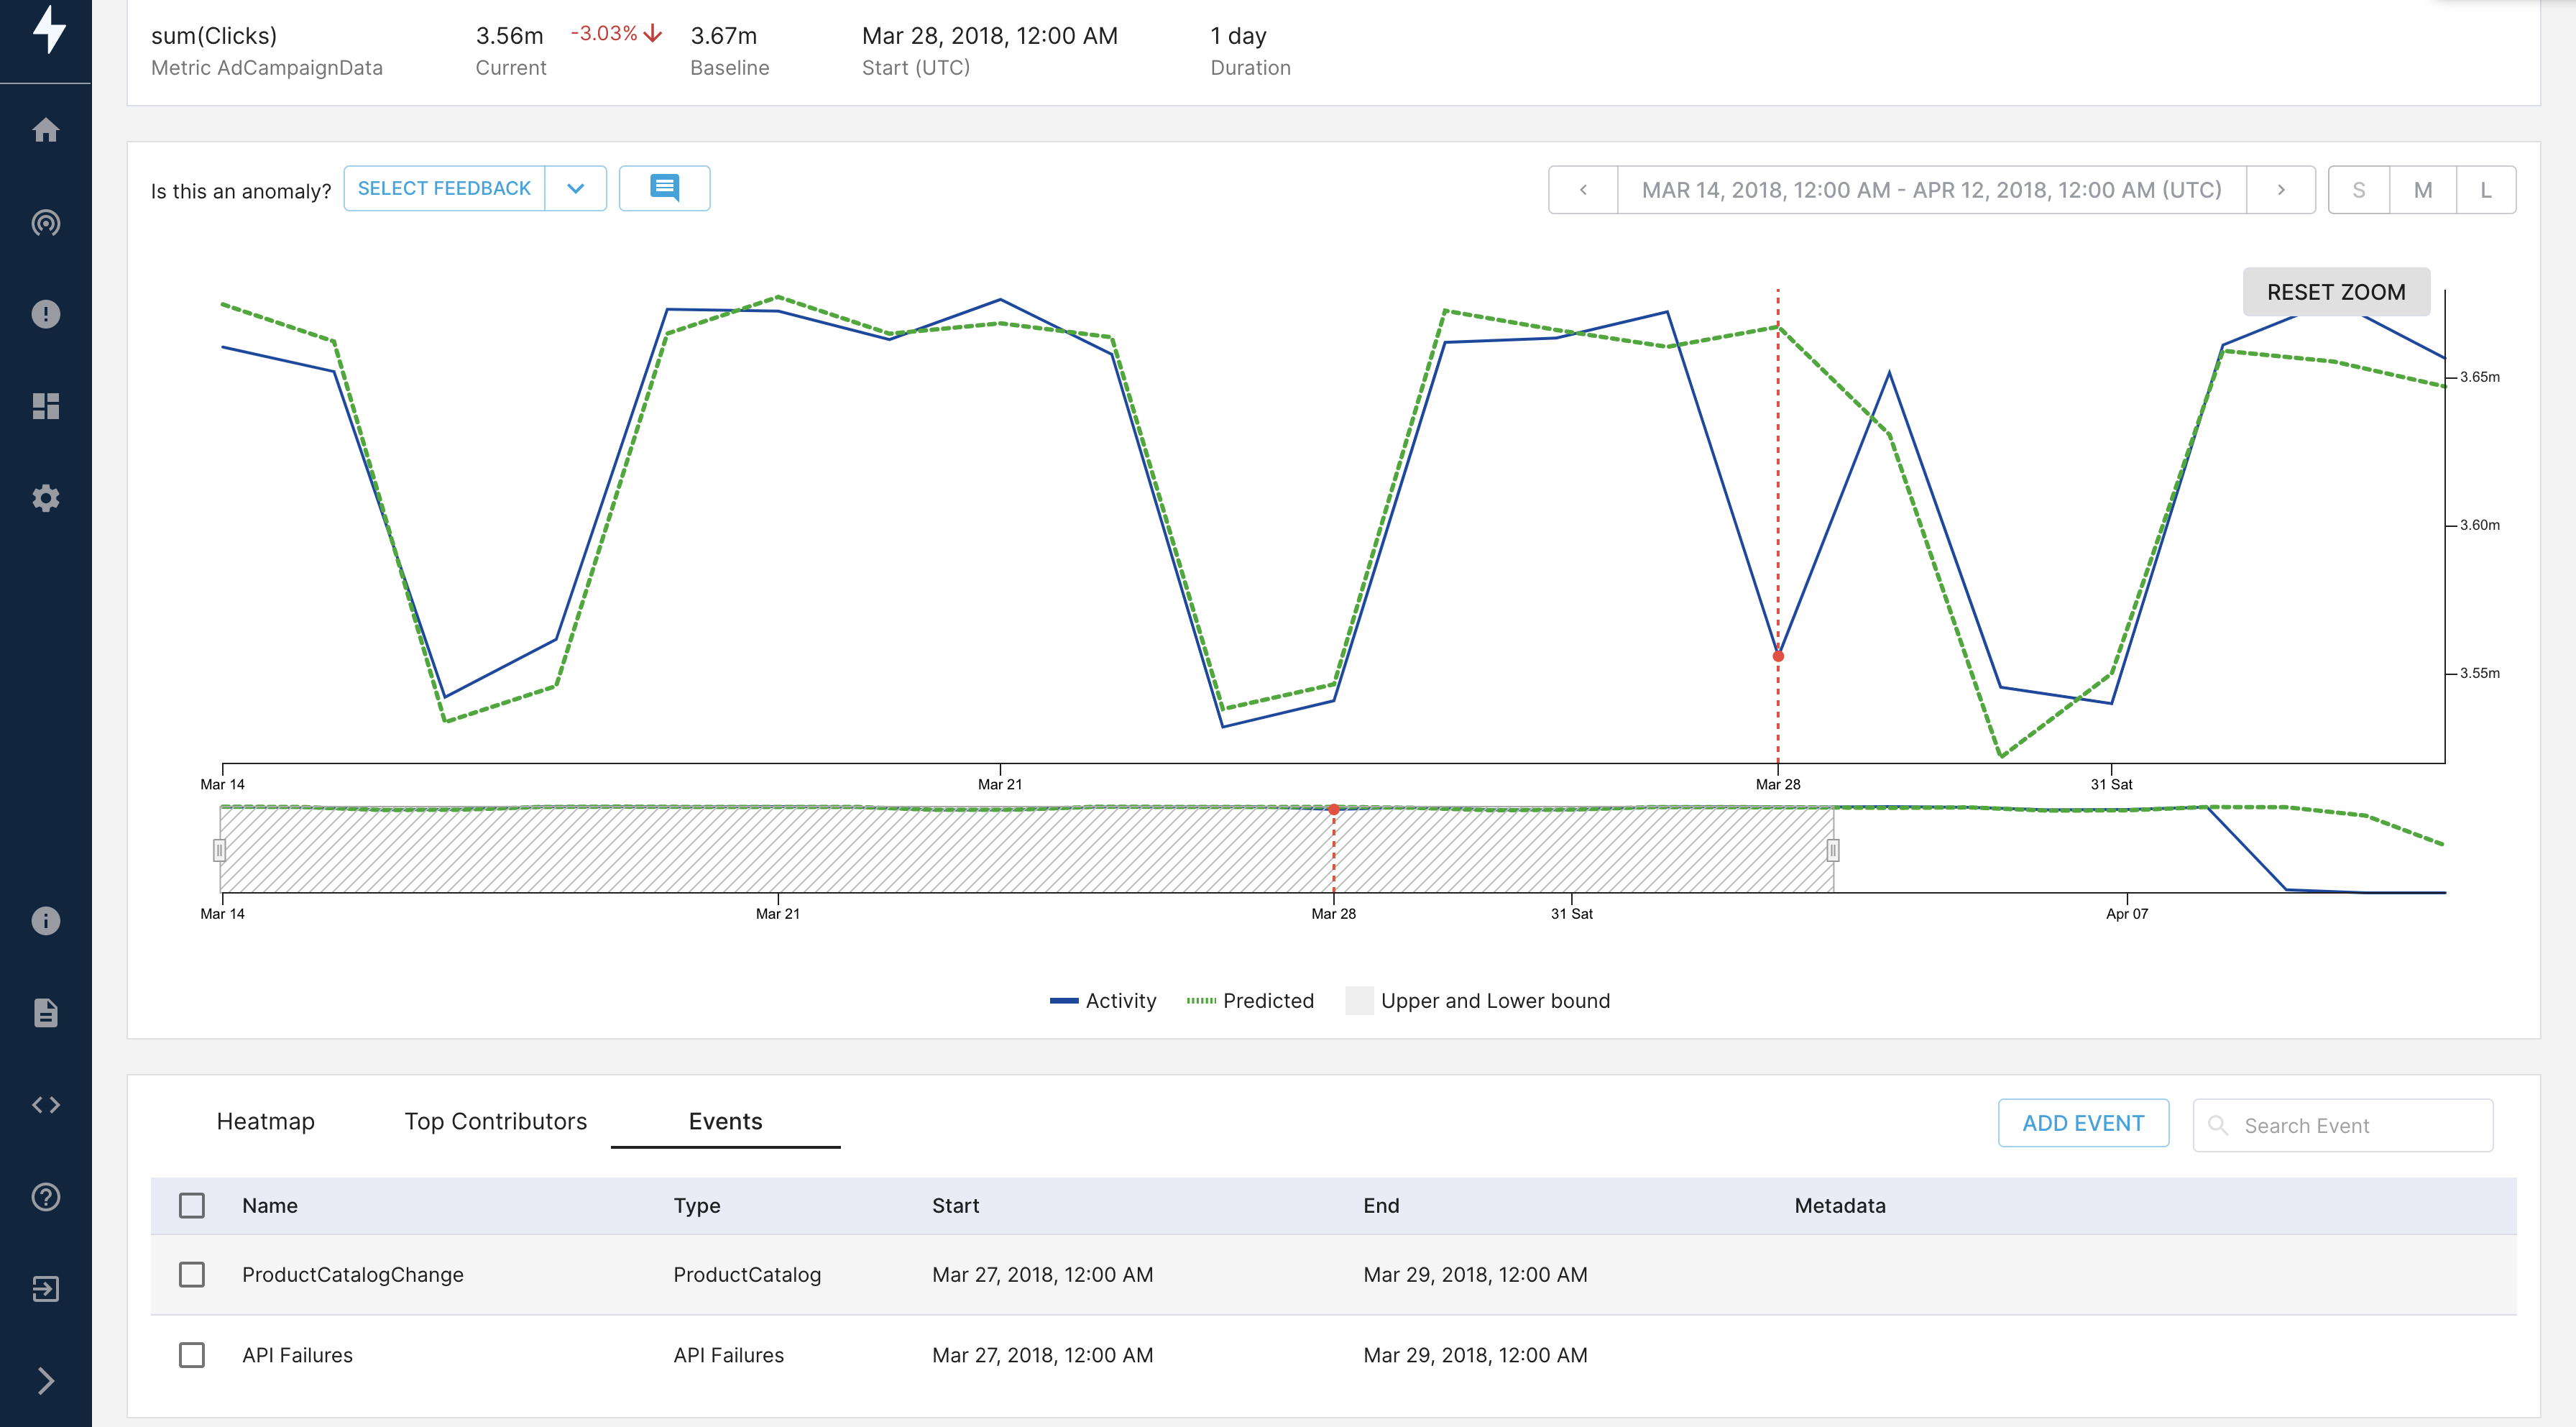
After noting the correlation between the dip and the two events, we can narrow our focus to these two events and validate our findings because we now see it is unlikely that the API failures were related to the ad campaign section, so we will assume there is nothing wrong with the ad campaign strategy.
But it's also interesting to see if the change in the catalog was not well received at first by the users, and it eventually worked (as the following trend looks normal). This can be an input to the catalog designers that users experienced some initial friction upon the catalog changes.
Want to learn more?
To learn more, join the StarTree Slack community (opens in a new tab)).
StarTree ThirdEye comes with a lot of API calls link you can use to build your own custom portals/web wrappers over StarTree ThirdEye. As a user, you have more control over using and customizing StarTree ThirdEye in creating great user experiences.
Interested in trying out StarTree ThirdEye?
Follow this link to find different deployment options for trying out StarTree ThirdEye.