Multiple inputs alerts
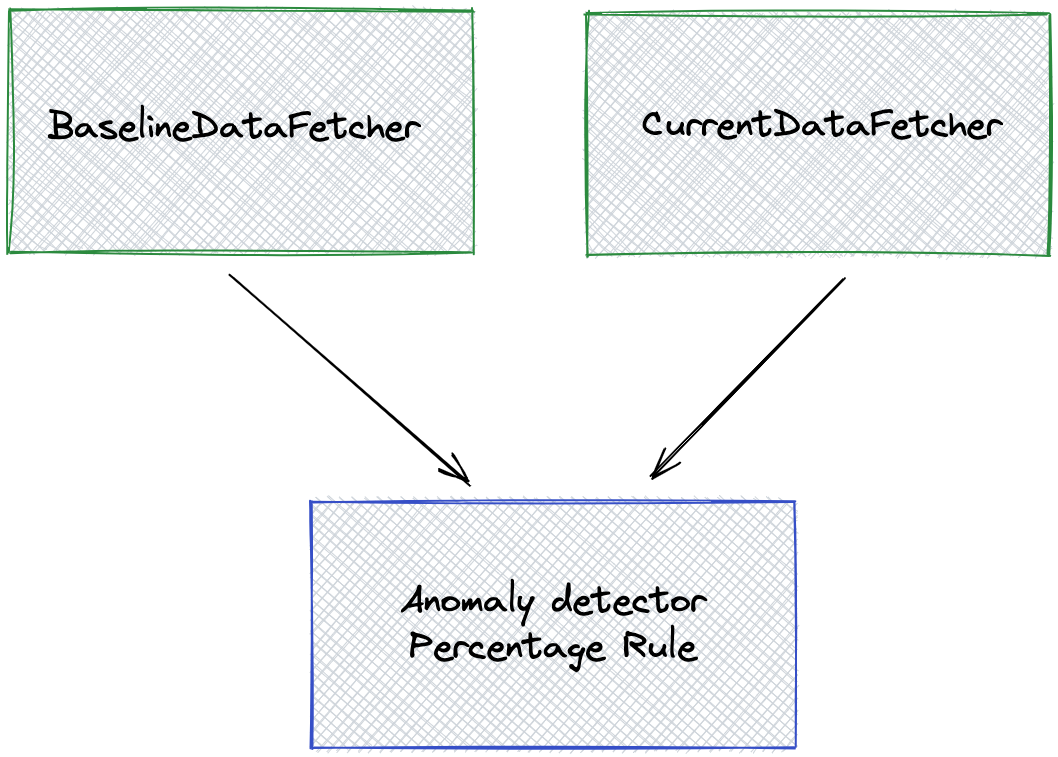
As explained in the alert configuration documentation, you can create detection pipelines that form DAGs with execution dependencies. In this example, we use the [percentage rule detector](../../concepts-data-alerts-notifications/ concepts-anomaly-detection-algorithms.md#percentage-change), which requires 2 inputs: baseline and current.
The pipeline looks like this:
Here is the corresponding configuration:
{
  "name": "pageviews",
  "description": "This is a sample detection",
  "cron": "0 */1 * * * ?",
  "template": {
    "nodes": [
      {
        "name": "root",
        "type": "AnomalyDetector",
        "params": {
          "type": "PERCENTAGE_CHANGE",
          "component.monitoringGranularity": "${monitoringGranularity}",
          "component.timestamp": "ts",
          "component.metric": "met",
          "component.percentageChange": "${percentageChange}",
          "component.pattern": "${pattern}",
          "anomaly.metric": "${metric}"
        },
        "inputs": [
          {
            "targetProperty": "baseline",
            "sourcePlanNode": "baselineDataFetcher",
            "sourceProperty": "baselineOutput"
          },
          {
            "targetProperty": "current",
            "sourcePlanNode": "currentDataFetcher",
            "sourceProperty": "currentOutput"
          }
        ],
        "outputs": []
      },
      {
        "name": "baselineDataFetcher",
        "type": "DataFetcher",
        "params": {
          "component.dataSource": "${dataSource}",
          "component.query": "SELECT __timeGroup(\"${timeColumn}\", '${timeColumnFormat}', '${monitoringGranularity}') as ts, ${metric} as met FROM ${dataset} WHERE __timeFilter(\"${timeColumn}\", '${timeColumnFormat}', ${lookback}, ${lookback}) GROUP BY ts ORDER BY ts LIMIT 1000"
        },
        "inputs": [],
        "outputs": [
          {
            "outputKey": "pinot",
            "outputName": "baselineOutput"
          }
        ]
      },
      {
        "name": "currentDataFetcher",
        "type": "DataFetcher",
        "params": {
          "component.dataSource": "${dataSource}",
          "component.query": "SELECT __timeGroup(\"${timeColumn}\", '${timeColumnFormat}', '${monitoringGranularity}') as ts, ${metric} as met FROM ${dataset} WHERE __timeFilter(\"${timeColumn}\", '${timeColumnFormat}') GROUP BY ts ORDER BY ts LIMIT 1000"
        },
        "inputs": [],
        "outputs": [
          {
            "outputKey": "pinot",
            "outputName": "currentOutput"
          }
        ]
      }
    ]
  },
  "templateProperties": {
    "dataSource": "pinotQuickStartLocal",
    "dataset": "pageviews",
    "metric": "sum(views)",
    "monitoringGranularity": "P1D",
    "timeColumn": "date",
    "timeColumnFormat": "yyyyMMdd",
    "percentageChange": "0.2",
    "offset": "P1W",
    "pattern": "up_or_down"
  }
}
percentage_rule_alert.json
Notice the pipeline has two DataFetcher nodes:
baselineDataFetcher, which has an output calledbaselineOutputcurrentDataFetcher, which has an output calledcurrentOutput
These outputs are then fed to the anomaly detector:
baselineOutputgoes into thebaselineproperty of the detectorcurrentOutputgoes into thecurrentproperty of the detector
{
  "name": "root",
  "type": "AnomalyDetector",
  "params": {
    "type": "PERCENTAGE_CHANGE", ...},
    "inputs": [
      {
        "targetProperty": "baseline",
        "sourcePlanNode": "baselineDataFetcher",
        "sourceProperty": "baselineOutput"
      },
      {
        "targetProperty": "current",
        "sourcePlanNode": "currentDataFetcher",
        "sourceProperty": "currentOutput"
      }
    ]
  }
If baseline and current properties were not given, the detector would fail.
About the baseline
To ensure the baseline timeframe is correctly computed based on the analysis timeframe,we'll look at the SQL queries:
currentDataFetcheruses the macrowhere __timeFilter(\"${timeColumn}\", '${timeColumnFormat}'): the macro automatically filters on the analysis timeframe.baselineDataFetcheruses the same macro, with an offset:where __timeFilter(\"${timeColumn}\", '${timeColumnFormat}', ${lookback}, ${lookback}), withoffset=P1W.P1Wmeans one week. This means the baseline is one week before the analysis timeframe.