How to use the alert creation UI
The alert creation UI is where you will create new alerts and there are 2 modes: Simple and Advanced.
- The
Simplemode will prompt you for the different parts of the alert configuration and build the configuration JSON. - You can see the current status of the JSON in
Advancedmode or switch to that mode to paste your own configuration.
How to access the alert creation UI
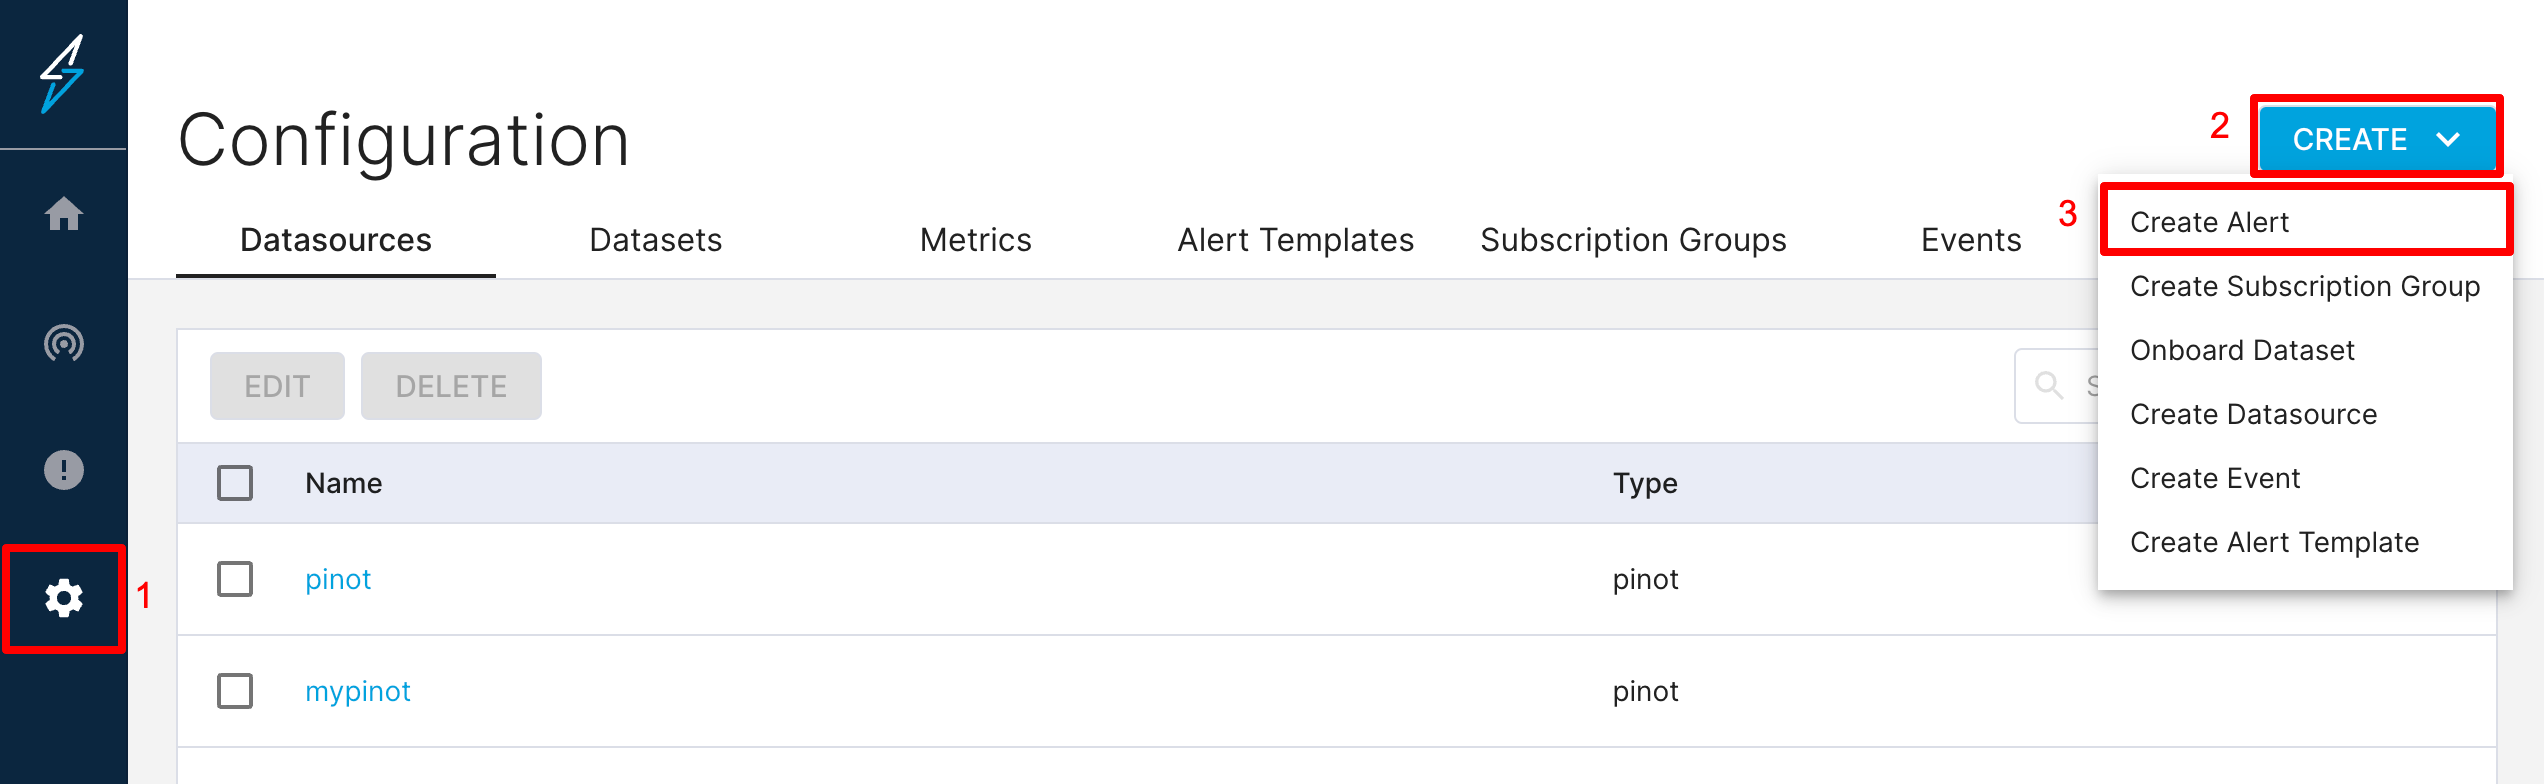
- Browse to the Configuration page.
- Click Create.
- Click the Create Alert menu item.
This will take you to the alert creation UI, defaulting to Advanced mode.
Simple Mode
You can switch to simple mode in the top right section of the page where there is a switch for the 2 modes.
The Sections
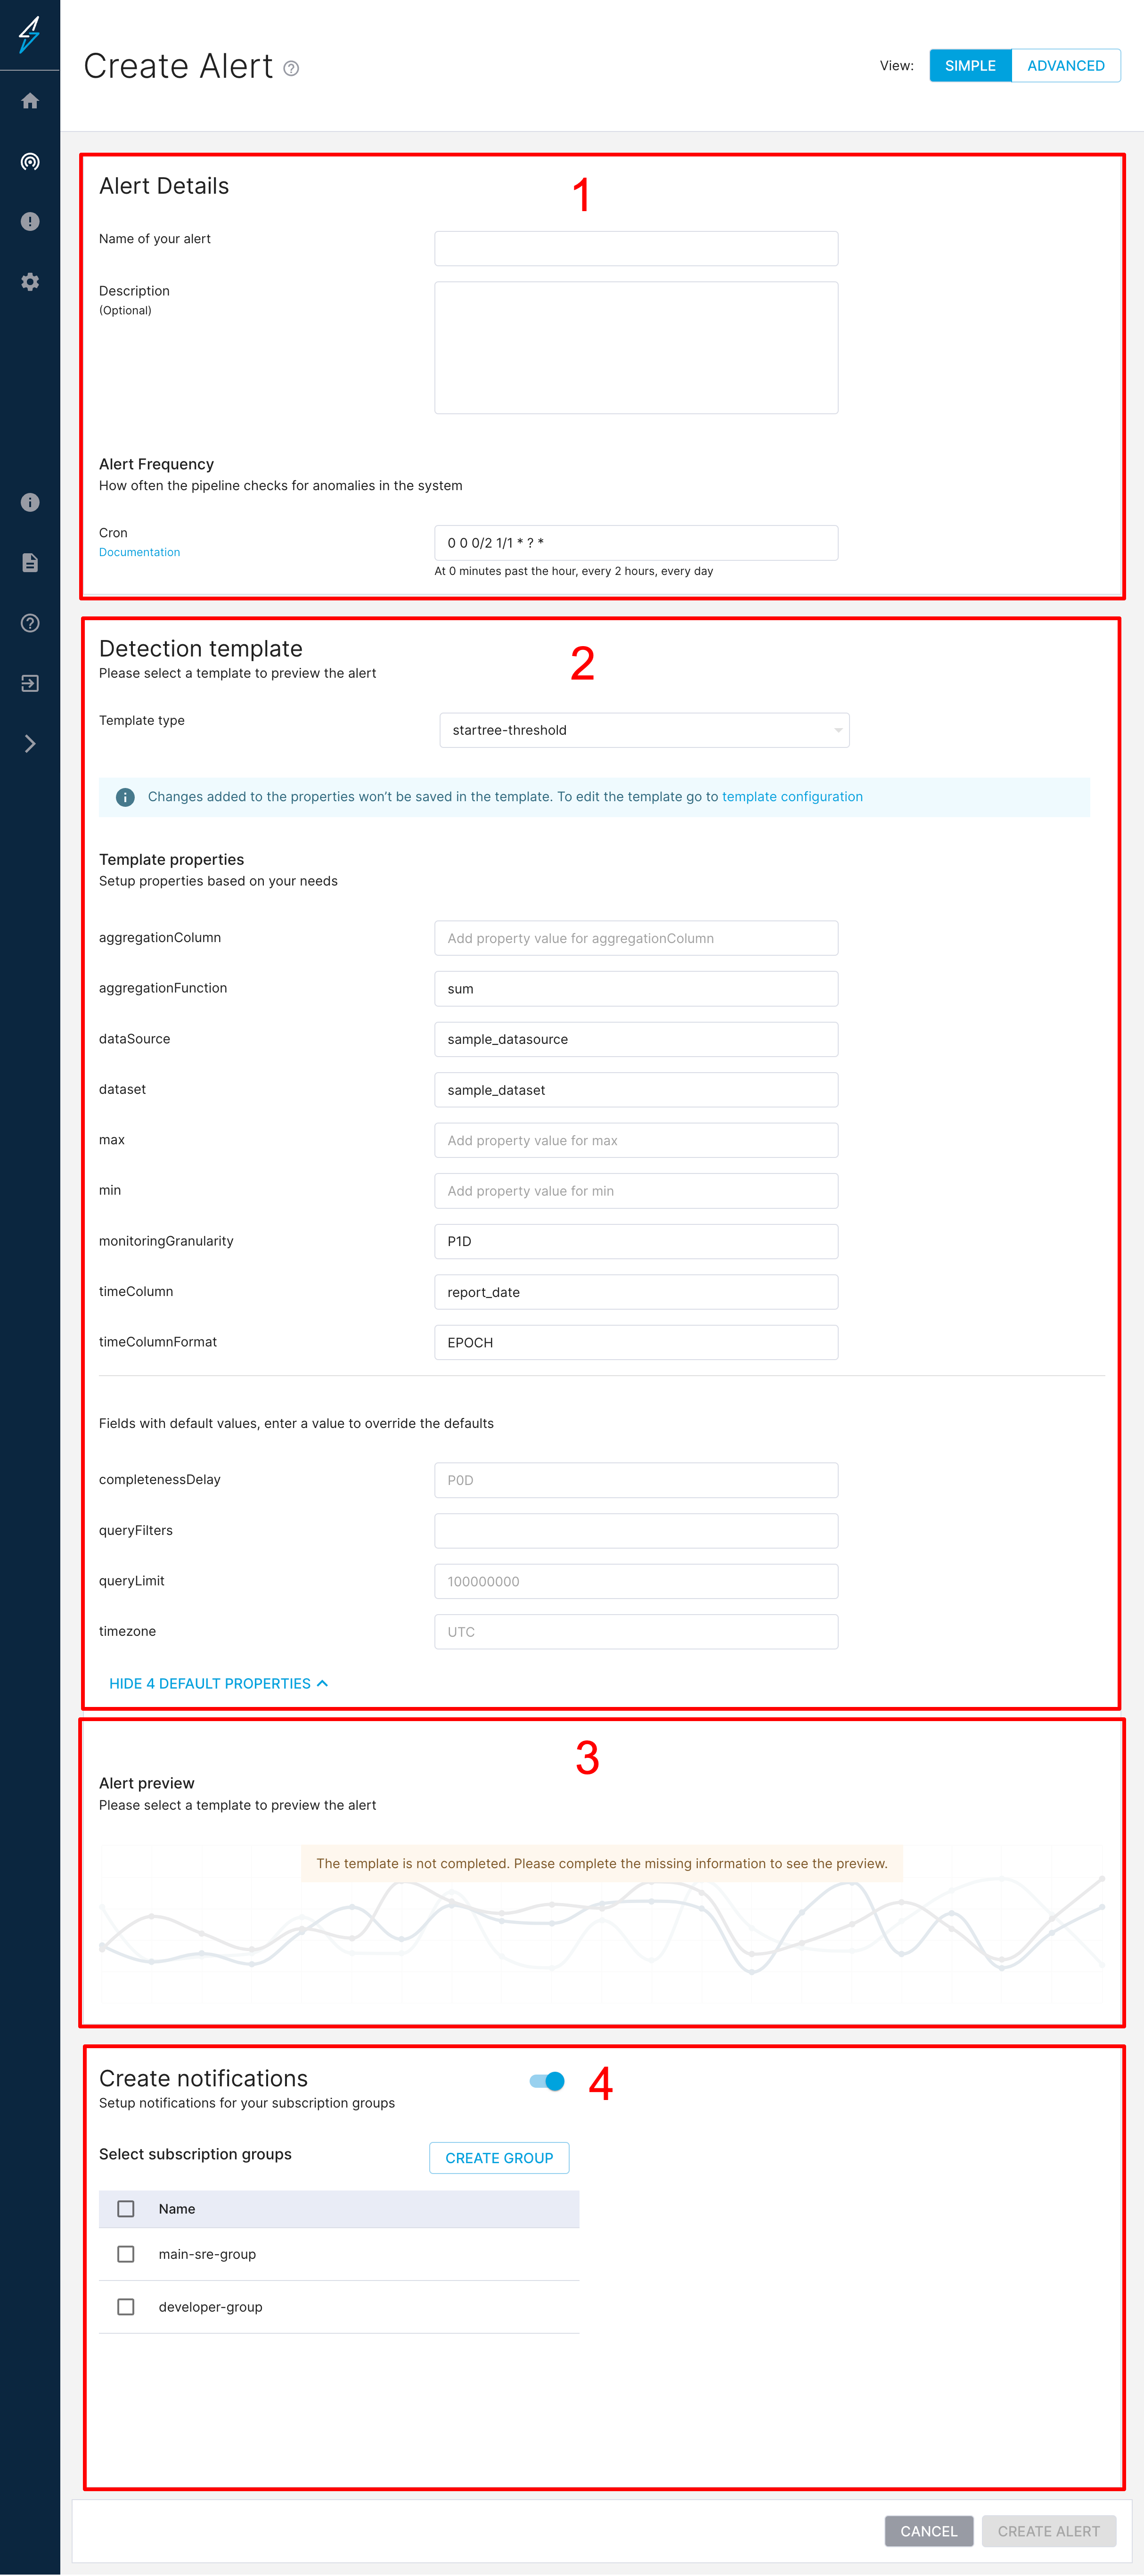
1 - Alert Details
In this section, you will be prompted to input the name of the alert. Ensure this is unique and no other existing alert has the same name.
The description is optional.
The cron section is where you can schedule where you can configure how often the pipelines checks for anomalies. The cron is expected to be in quartz (opens in a new tab) format.
2 - Template Property Input
This section allows you to select an Alert Template to use for your configuration. Alert templates are entities in ThirdEye that help make creating new alerts with less copying and pasting. Several come out of the box with a new installation of ThirdEye. Alert templates require you to enter properties specific to your environment which you will be prompted for in the section below Template type.
3 - Preview Configuration
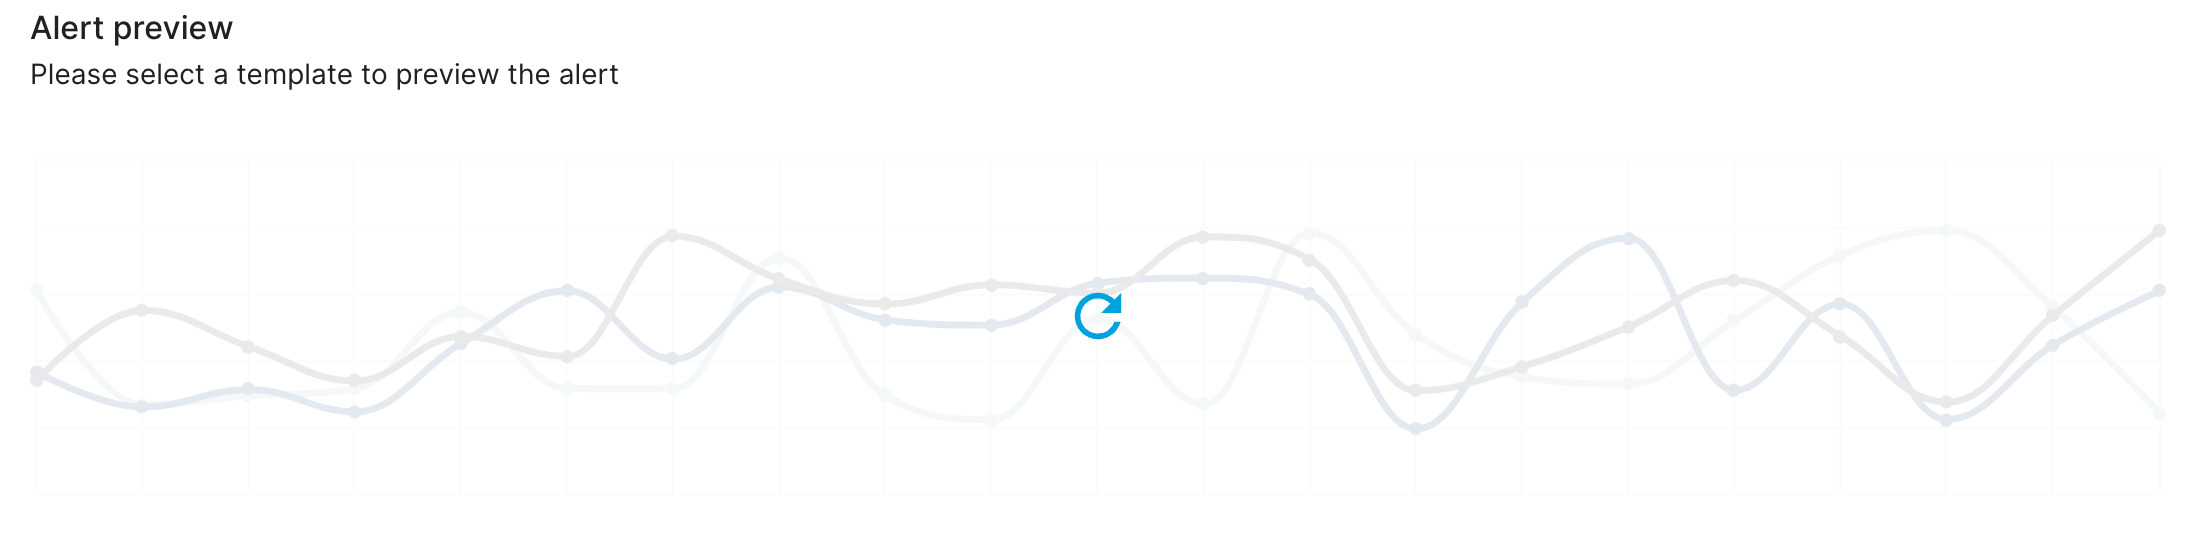
This section allows you to preview the alert configuration by seeing the metric trend and the anomalies that may be detected. You will see a button to preview once all the template properties are input.
The preview button looks like the one below:
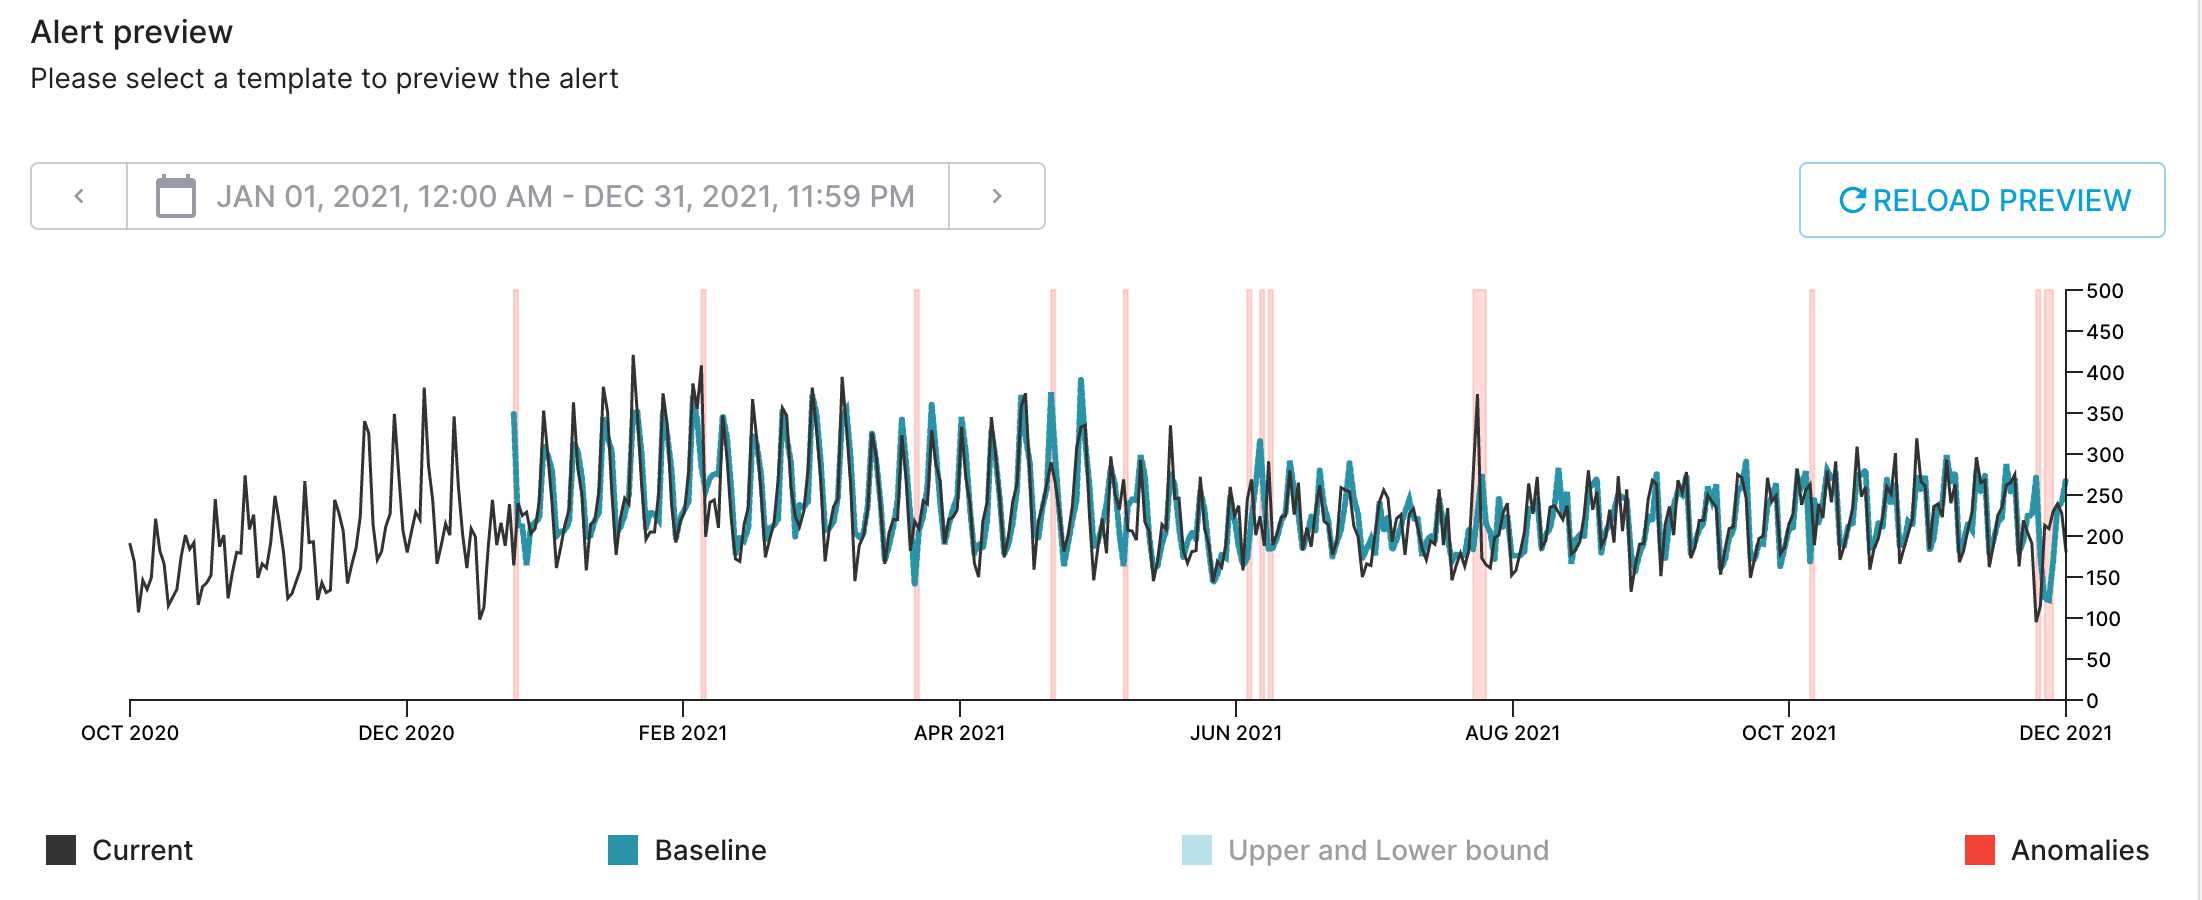
When data is loaded, it will look like the screenshot below
4 - Notification Configuration
This section allows you to configure which groups will be alerted when there are new anomalies.
Advanced Mode
The Sections
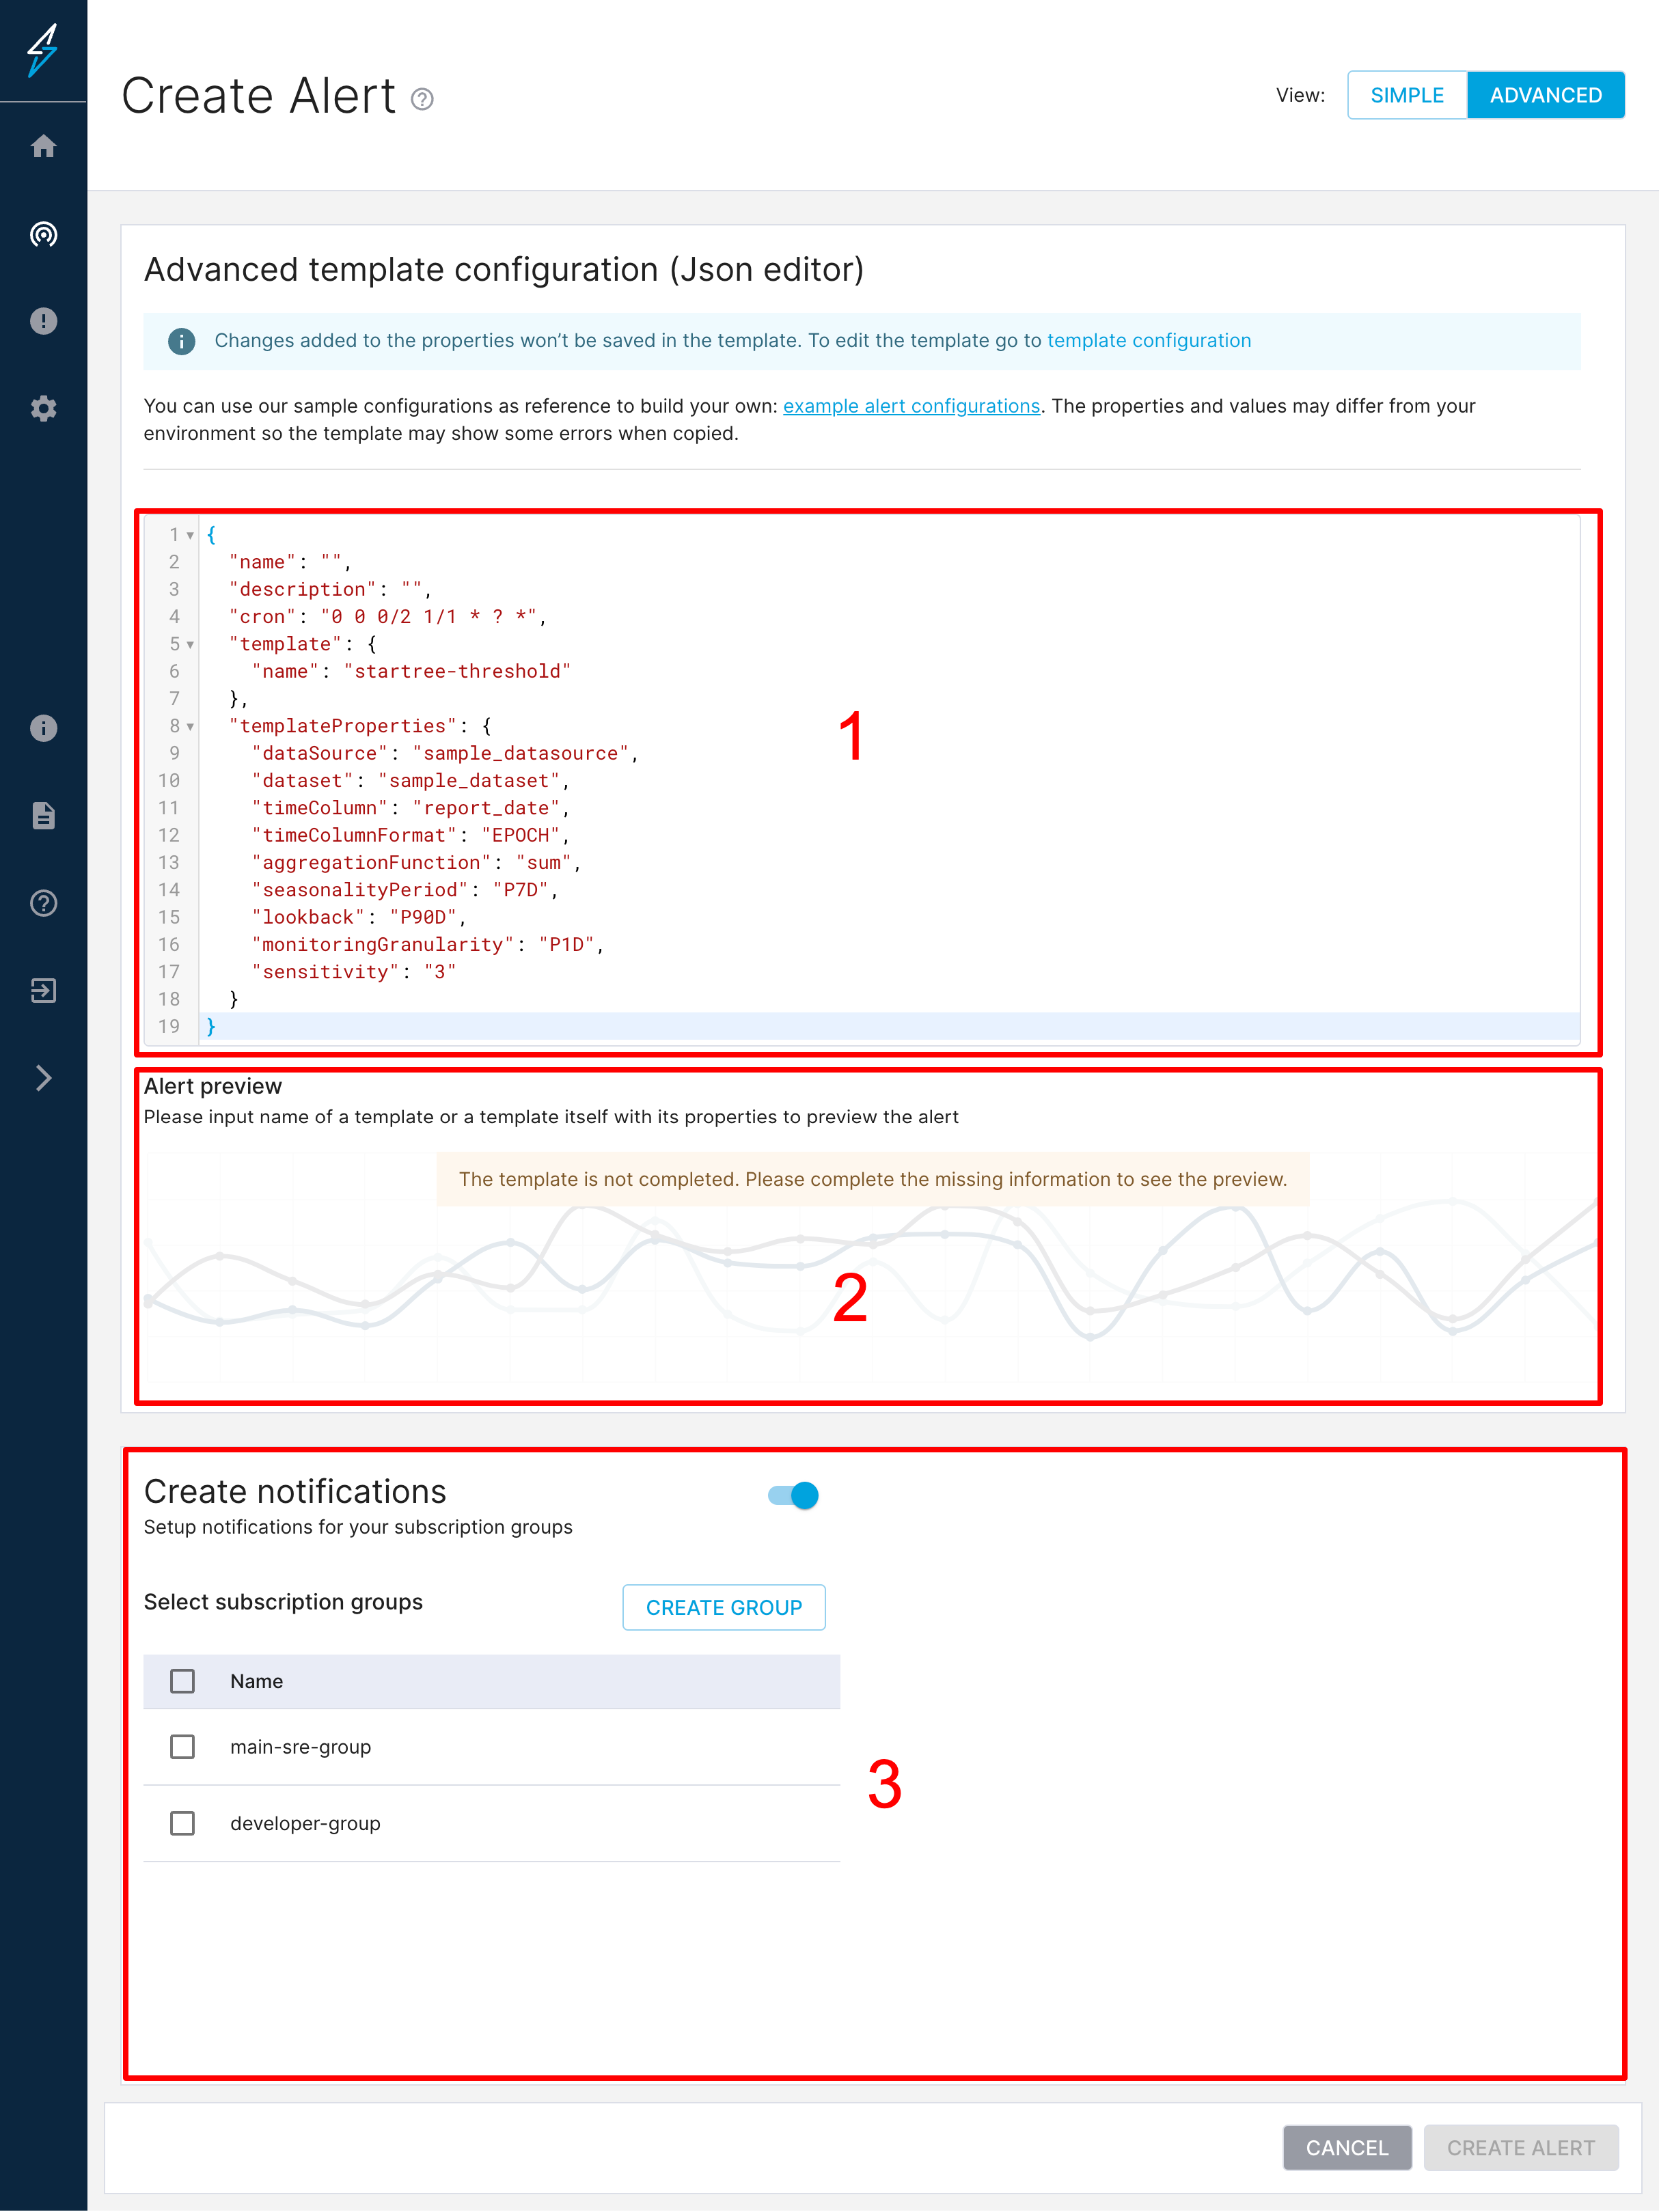
1 - JSON Editor
You can copy and paste JSON into here.
2 - Preview Configuration
This section allows you to preview the alert configuration by seeing the metric trend and the anomalies that may be detected. You will see a button to preview once all the template properties are input.
The preview button looks like the one below:
When data is loaded, it will look like the screenshot below
3 - Notification Configuration
This section allows you to configure which groups will be alerted when there are new anomalies.